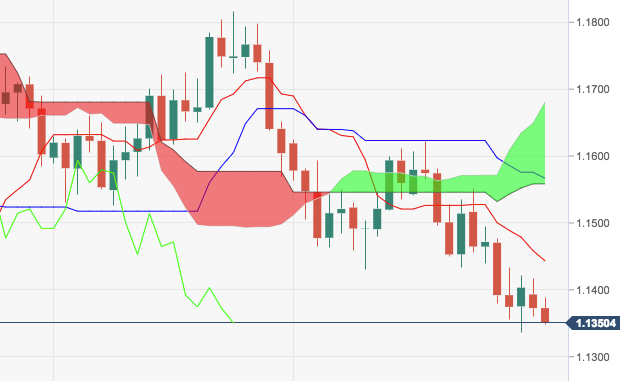
- The pair is extending its downside momentum in the first half of the week, opening the door for a potential test of last week’s low at 1.1332, which emerges as the immediate support.
- Further south emerges the critical 200-week SMA at 1.1316. A break below this level should expose 2018 low at 1.1299.
- On the flip side, up ticks should meet resistance in the 1.1430 region, where converge recent failed bullish attempts and the 10-day SMA.
EUR/USD daily chart
EUR/USD
Overview:
Last Price: 1.135
Daily change: -1.8e+2 pips
Daily change: -1.57%
Daily Open: 1.1531
Trends:
Daily SMA20: 1.1571
Daily SMA50: 1.1584
Daily SMA100: 1.1623
Daily SMA200: 1.1909
Levels:
Daily High: 1.154
Daily Low: 1.1531
Weekly High: 1.1551
Weekly Low: 1.1336
Monthly High: 1.1816
Monthly Low: 1.1526
Daily Fibonacci 38.2%: 1.1496
Daily Fibonacci 61.8%: 1.1472
Daily Pivot Point S1: 1.1453
Daily Pivot Point S2: 1.1392
Daily Pivot Point S3: 1.1351
Daily Pivot Point R1: 1.1555
Daily Pivot Point R2: 1.1596
Daily Pivot Point R3: 1.1657
