“¢ Breaks down of the Asian session consolidation phase and resumes with the post-ECB rejection slide from a descending trend-line resistance on the daily chart.
“¢ A retest of previous support now turned resistance, and a subsequent drop now paves the way for an extension of the downward trajectory.
“¢ Short-term technical indicators on the 1-hourly chart are still far from being in oversold territory and further reinforce the bearish outlook.
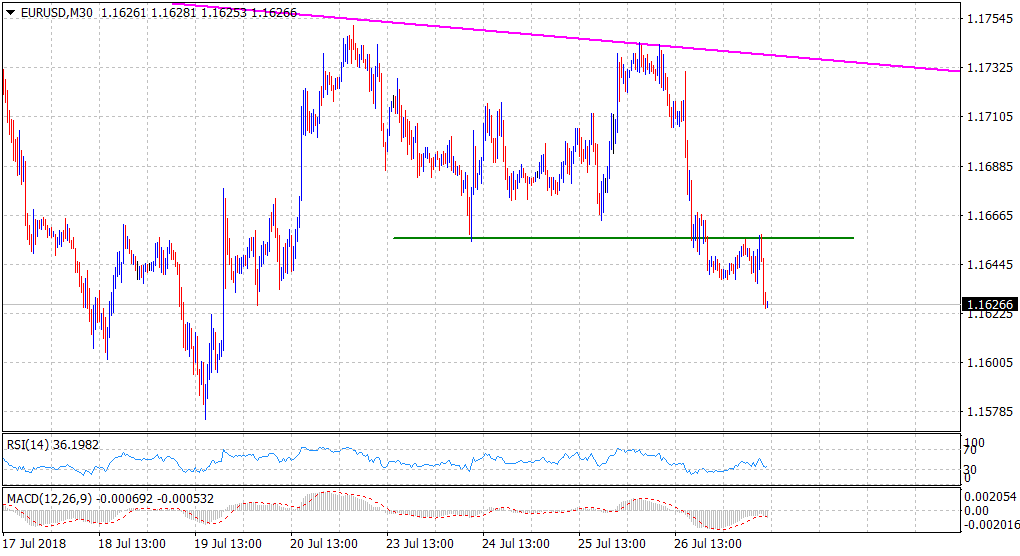
Spot rate: 1.1627
Daily High: 1.1658
Trend: Bearish
Resistance
R1: 1.1658 (current day swing high)
R2: 1.1680 (horizontal zone)
R3: 1.1712 (R1 daily pivot-point)
Support
S1: 1.1607 (S1 daily pivot-point)
S2: 1.1575 (monthly swing low set on July 19)
S3: 1.1540-35 (horizontal zone)
