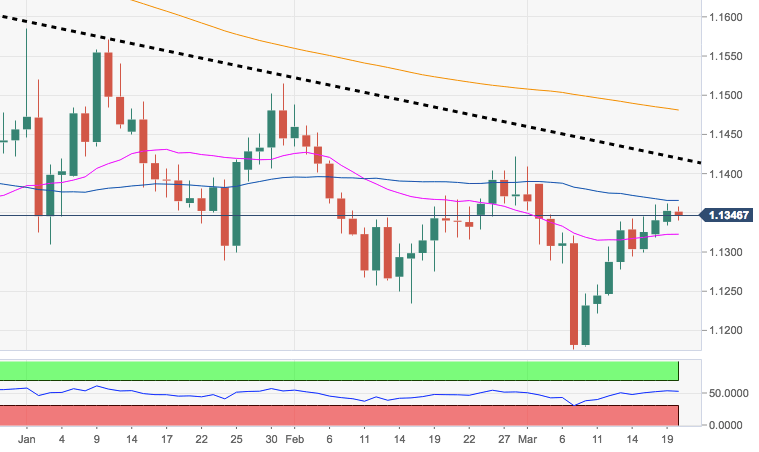
- The upside momentum in EUR/USD met a strong hurdle in the 1.1365/60 band, where align the key 55-day/100-day SMAs.
- Spot needs to clear this area to allow for a test of the key 5-month resistance line at 1.1419, coincident with late February peaks, and to alleviate immediate downside pressure.
- This area is regarded as the last defence for a test of the 1.1500 neighbourhood and possibly beyond.
EUR/USD daily chart
EUR/USD
Overview:
Today Last Price: 1.1345
Today Daily change: 17 pips
Today Daily change %: -0.07%
Today Daily Open: 1.1353
Trends:
Daily SMA20: 1.1322
Daily SMA50: 1.1361
Daily SMA100: 1.1369
Daily SMA200: 1.1483
Levels:
Previous Daily High: 1.1362
Previous Daily Low: 1.1334
Previous Weekly High: 1.1346
Previous Weekly Low: 1.1222
Previous Monthly High: 1.1489
Previous Monthly Low: 1.1234
Daily Fibonacci 38.2%: 1.1351
Daily Fibonacci 61.8%: 1.1345
Daily Pivot Point S1: 1.1337
Daily Pivot Point S2: 1.1321
Daily Pivot Point S3: 1.1308
Daily Pivot Point R1: 1.1366
Daily Pivot Point R2: 1.1378
Daily Pivot Point R3: 1.1394
