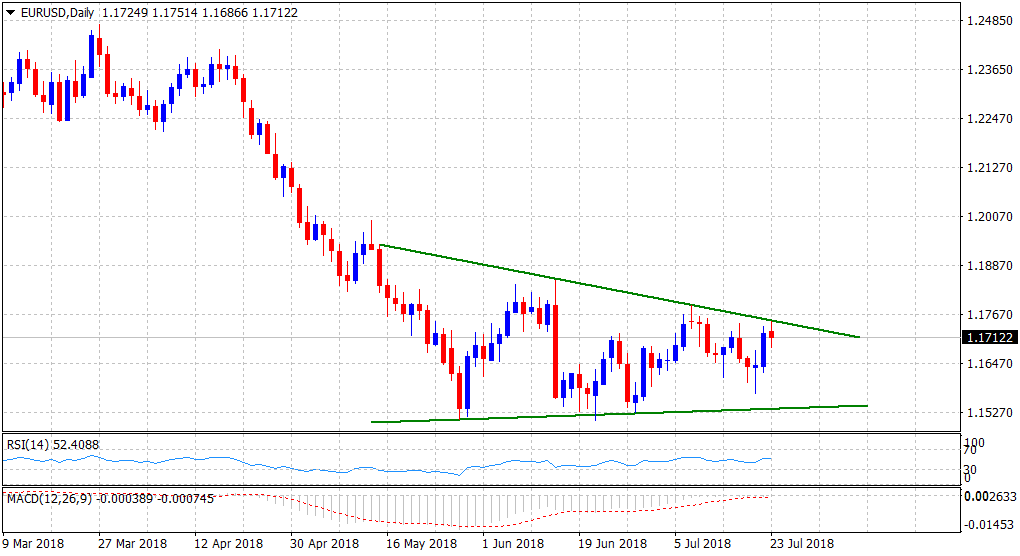
“¢ A modest USD rebound caps the ongoing positive momentum near a descending trend-line resistance, extending from May 15 tops through highs posted on June 14 and July 9.
“¢ The said trend-line also constitutes towards a descending triangular formation on the daily chart and hence, should continue to act as a key hurdle amid neutral short-term technical indicators.
“¢ It would now be interesting to see if the pair is able to make it through the mentioned barrier or remains within a familiar trading range ahead of Thursday’s key ECB monetary policy decision.
Spot rate: 1.1712
Daily High: 1.1751
Daily Low: 1.1687
Trend: Neutral
Resistance
R1: 1.1751 (current day swing high)
R2: 1.1791 (monthly high set on July 9)
R3: 1.1809 (R2 daily pivot-point)
Support
S1: 1.1665 (100-period SMA H1)
S2: 1.1635 (horizontal zone)
S3: 1.1600 (round figure mark)
