EURUSD Daily chart
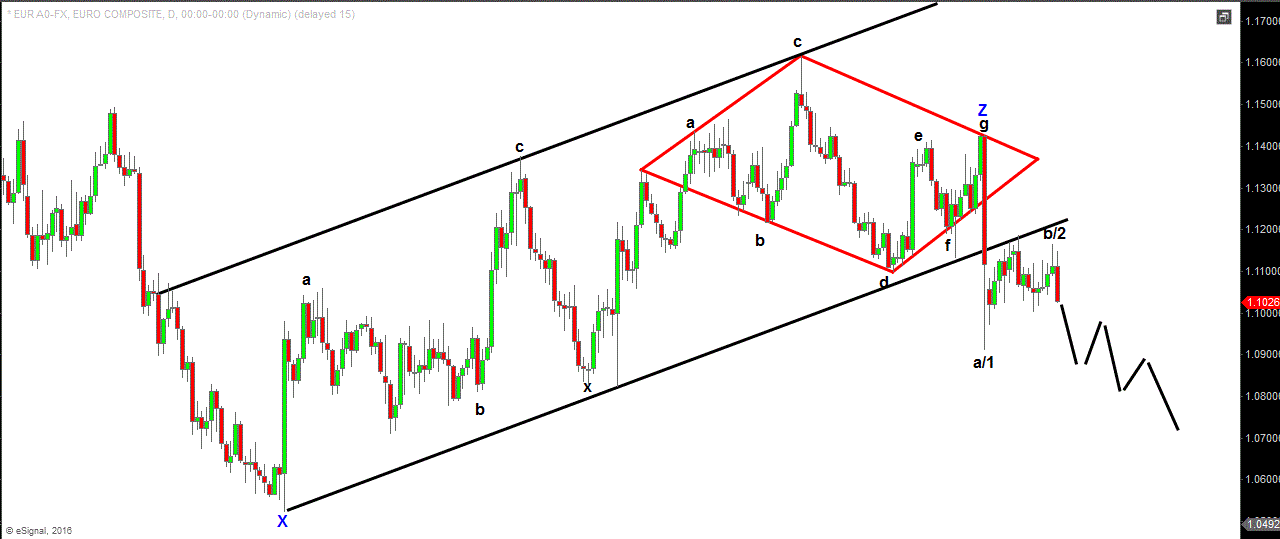
In the above EURUSD daily chart, the pair was moving higher in the upward sloping channel since December 2015. It has breached the channel and Diamond pattern (marked by red color line) on downside after Britain decided to leave EU. As per wave perspective, the pair has completed minor wave Z of a complex correction W-X-Y-X-Z near 1.1400 levels and resumed the major downtrend. In the previous week it did not move beyond the resistance of 1.1200 and formed the big red candle after shooting star pattern. This indicates the end of wave b/2 near 1.1165 levels and started the next leg on downside in the form of wave c/3. In nutshell, as long as the pair sustain below 1.1200 levels bias is negative and it could move lower towards 1.0700-1.06500 levels which is the pattern target and 100% Fibonacci projection for wave c/3
Dollar index 240 mins chart
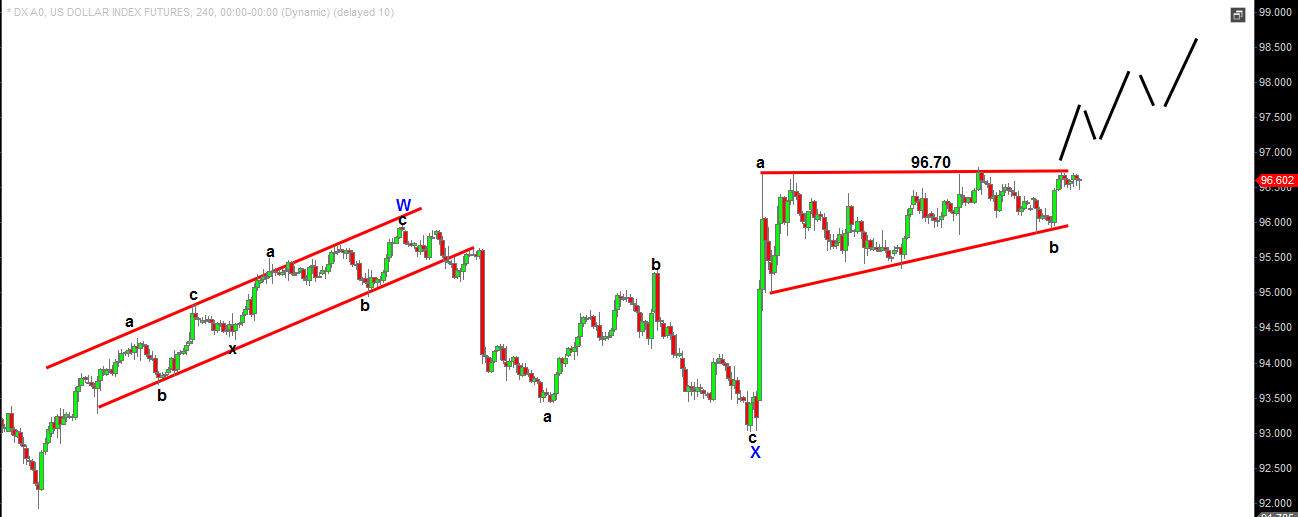
In the above dollar index 240 mins chart, post brexit, index is moving in consolidation and formed the ascending triangle pattern in the minuette wave b. Index has completed wave X near 93 levels and currently moving higher in the form of wave Y. In last 2 weeks index failed to move above the resistance of 96.70 levels and pulled back. In the last trading session of the previous week, index found support near the upward sloping trendline of the pattern and it is on the brink to break the pattern on the upside. A close above 96.70 could open up the possibility for the move towards 98.25-98.50 which is the pattern target.
Guest post by Mohnish Shah