This MT4 chart plots the EURUSD daily chart. Based on the Volatility Trend Following strategy, EURUSD looks to begin a bear trend. The green support line has turned into a red resistance.
We cross check this with the blue line at the bottom, which indicates the 10 period rate of change of the 20 period exponential moving average.
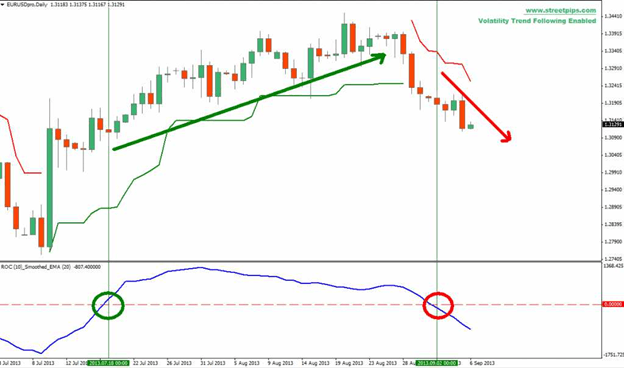
While most moving average strategies use a faster moving average crossing over a slower moving average, the blue line above isolates the 20 period moving average and observes its rate of change. It shows the strength of the trend. A moving average line on its own shows the direction of a trend but does not show the strength of the trend. It is the gradient of the moving average line which indicates the strength – a steeper gradient indicates a stronger trend, and this gradient is the rate of change.
As the blue line crosses from negative to positive (circled in green), the rate of change is positive, and a bull trend is starting
As the blue line crosses from positive to negative (circled in red), the rate of change is negative, and a bear trend is starting
While risk is to the downside, traders should take note of potential whipsaws, which are common in trend following forex trading strategies.
Written By: Streetpips.com
Profile bio: Streetpips.com scans books and websites for trading strategy ideas. We then select those which are programmable, code them, and share these with our members.
