EUR/USD was trading in a more volatile manner, climbing above range, but this did not hold, and eventually the pair fell. It certainly enjoyed a wider trading range. German GDP stands out this week. Here is an outlook for the highlights of this week and an updated technical analysis for EUR/USD.
German factory orders disappointed with a drop, casting worries about the strength of the largest economy in the euro-zone. PMIs were more or less in line with projections. In the US, data was quite mixed, with PMIs slightly missing expectations, until the NFP came. The US gained 255K jobs, and other components of the report were also positive. EUR/USD dropped under the H&S pattern and closed the week lower.
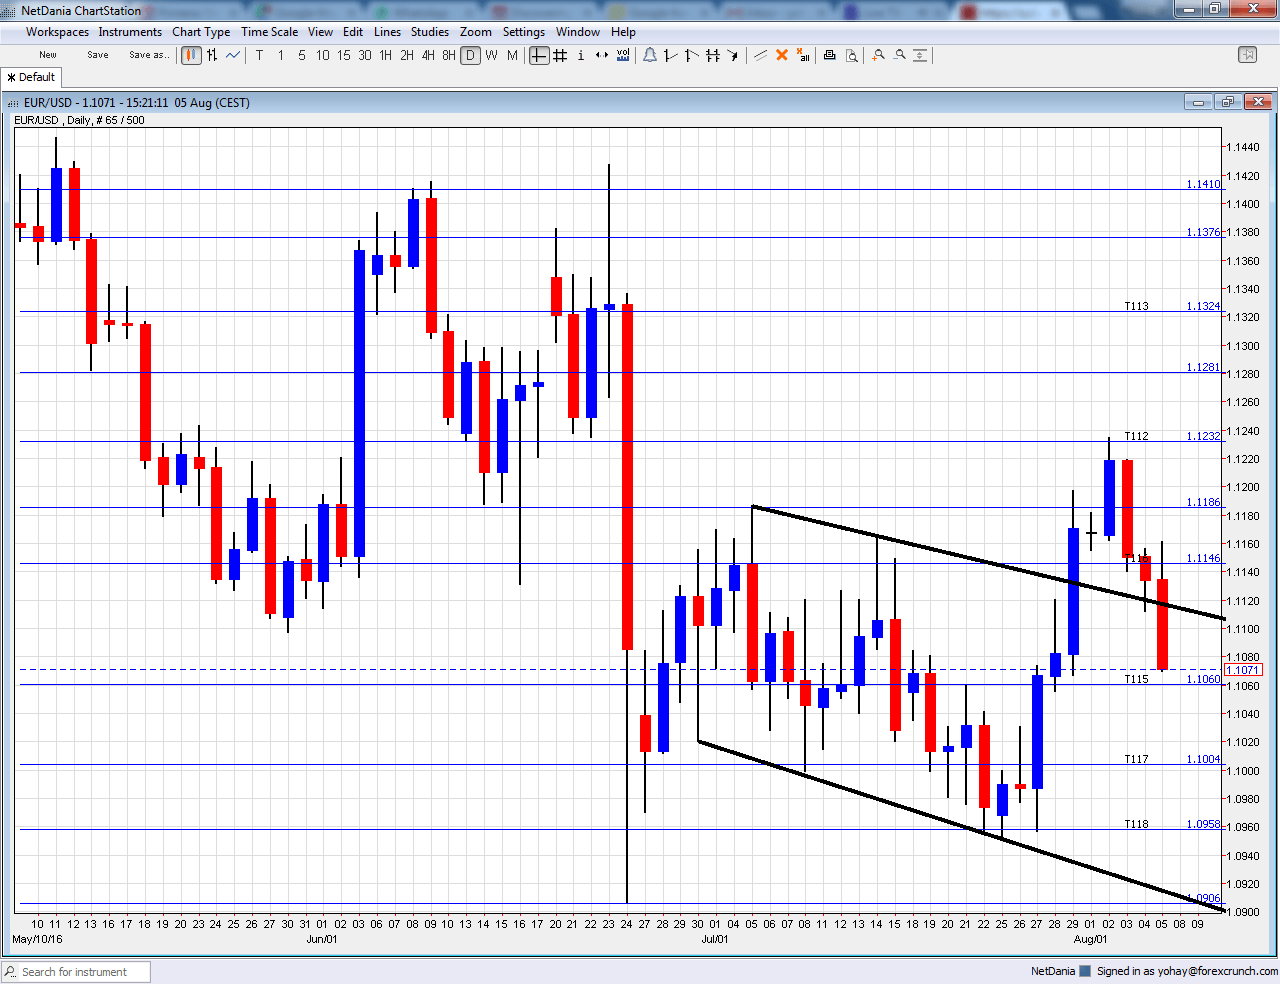
[do action=”autoupdate” tag=”EURUSDUpdate”/]EUR/USD daily chart with support and resistance lines on it. Click to enlarge:
- German Industrial Production: Monday, 6:00. Industrial output in the continent’s powerhouse disappointed with a drop of 1.3% in May. The data for June will likely be more upbeat with +0.9%.
- Sentix Investor Confidence: Monday, 8:30. This investor barometer showed a sharp reaction to Brexit in the July edition. It fell sharply from 9.9 to 1.7 points. A bounce to 3.6 is on the cards.
- German Trade Balance: Tuesday, 6:00. German exports and the resulting trade surplus keep the euro bid. The locomotive had a surplus of 22.2 billion euros in May. A level of 23.2 billion is on the cards.
- French Industrial Production: Wednesday, 6:45. Europe’s second largest economy saw a drop of 0.5% in its industrial output in May after the significant rise of 1.2% in the previous month. A rise of 0.3% is likely now.
- French CPI (final): Thursday, 6:45. According to the initial publication, prices dropped 0.4% in July. The final release is projected to confirm it.
- German GDP: Friday, 6:00. Europe’s largest economy enjoyed a high growth rate of 0.7% in Q1, pushing up the whole euro-zone economy. The second quarter saw slower growth according to all assessments. A growth rate of 0.3% is projected. Note that at the same we will get the final German CPI but changes are rare, and the GDP report is far more important
- French Non-Farm Payrolls: Friday, 6:45. This quarterly report on jobs showed an advance of 0.2% in Q1. We now get the preliminary figure for Q2. An advance of 0.2% is predicted.
- Italian GDP: Friday, 8:00. Italy, the third-largest economy, saw a growth rate of 0.3% in Q1. A growth rate of 0.2% is what markets are looking for.
- Flash GDP: Friday, 9:00. The initial release of euro-zone GDP showed a growth rate of 0.3% in Q2, but this figure did not include Germany’s number. This revision will already include the largest economy. No change is expected.
- Industrial Production: Friday, 9:00. Industrial output fell 1.2% in May, worse than had been expected. A bounce could be seen now, worth 0.6%.
* All times are GMT
EUR/USD Technical Analysis
Euro/dollar traded under 1.1190 (mentioned last week). The pair did break higher but was blocked at 1.1230. But from there things turned sour and the pair dropped.
Technical lines from top to bottom:
1.1535 is a stepping stone as seen in May 2016 and also beforehand. It is followed by the very round level of 1.15.
1.1460 was a key resistance line in 2015 and 1000 above the multi-year lows. 1.1410 capped the pair in early June. 1.1375 worked as resistance in February and as support in May 2016.
1.1335 worked as the lower bound of a higher range and then capped recovery attempts in May. 1.1230 capped the pair after the fall in May and works as resistance.
1.1190 is the post-Brexit high seen in July. 1.1140 cushioned the pair in October. 1.1070 served as a clear separator of ranges during February and also beforehand.
1.10 is a round number and significant resistance. 1.0905 is the swing low seen in June and serves as a weak support. 1.0825 worked as support in early March 2015 and should also be watched. This is now a triple bottom.
The post-Draghi low 1.0780 replaces 1.08 as support. 1.0710 is the next support line on the chart after temporarily capping the pair in April 2015.
Further below, the 2016 low of 1.0520 and the 2015 low of 1.0460 provide further support.
Temporarily breaking above the downtrend channel
As the thick black lines show, the pair traded in a downtrend channel and has now broken above it. The breakout was followed by a breakdown.
I am bearish on EUR/USD
The Stress Tests and the data fail to convince markets in the old continent’s strength, and the ECB may need to do more. The massive BOE easing adds to this pressure. In the US, the jobs report gave the greenback its mojo.
Our latest podcast is titled Carney King of Governors, Small in Japan
