- The EUR/USD pair maintains a bearish bias as long as it stays under the median line (ML).
- A new lower low may activate more declines towards the sliding line (SL).
- Only a valid breakout through the median line (ML) could invalidate a downside continuation.
EUR/USD forecast – the EUR/USD pair drops like a rock after the US inflation data release. The bias was still bearish ahead of the US data dump.
The greenback needed a bullish spark to be able to take full control again. The pair drops as the Dollar Index has managed to rebound and to recover after its temporary decline.
3 Free Crypto Signals Every Week – Full Technical Analysis
The United States Consumer Price Index registered a 0.4% growth in September beating the 0.3% expected and versus the 0.3% growth registered in August. Moreover, the Core CPI rose by 0.2% in September matching expectations, after only a 0.1% growth in the previous reporting period.
Higher inflation could force the Federal Reserve to hike rates sooner. The USD is bullish right now only because the traders think that the FED will take action in the coming monetary policy meetings.
Don’t forget that the FOMC Meeting Minutes will be released tonight. This is seen as a high-impact event as well. A hawkish report may help the Dollar Index to approach and reach fresh new highs. This scenario signals that the USD could appreciate versus the other major currencies.
If you are interested in forex day trading then read our helpful guide.
EUR/USD Forecast: Price Technical Analysis – Dynamic Resistance
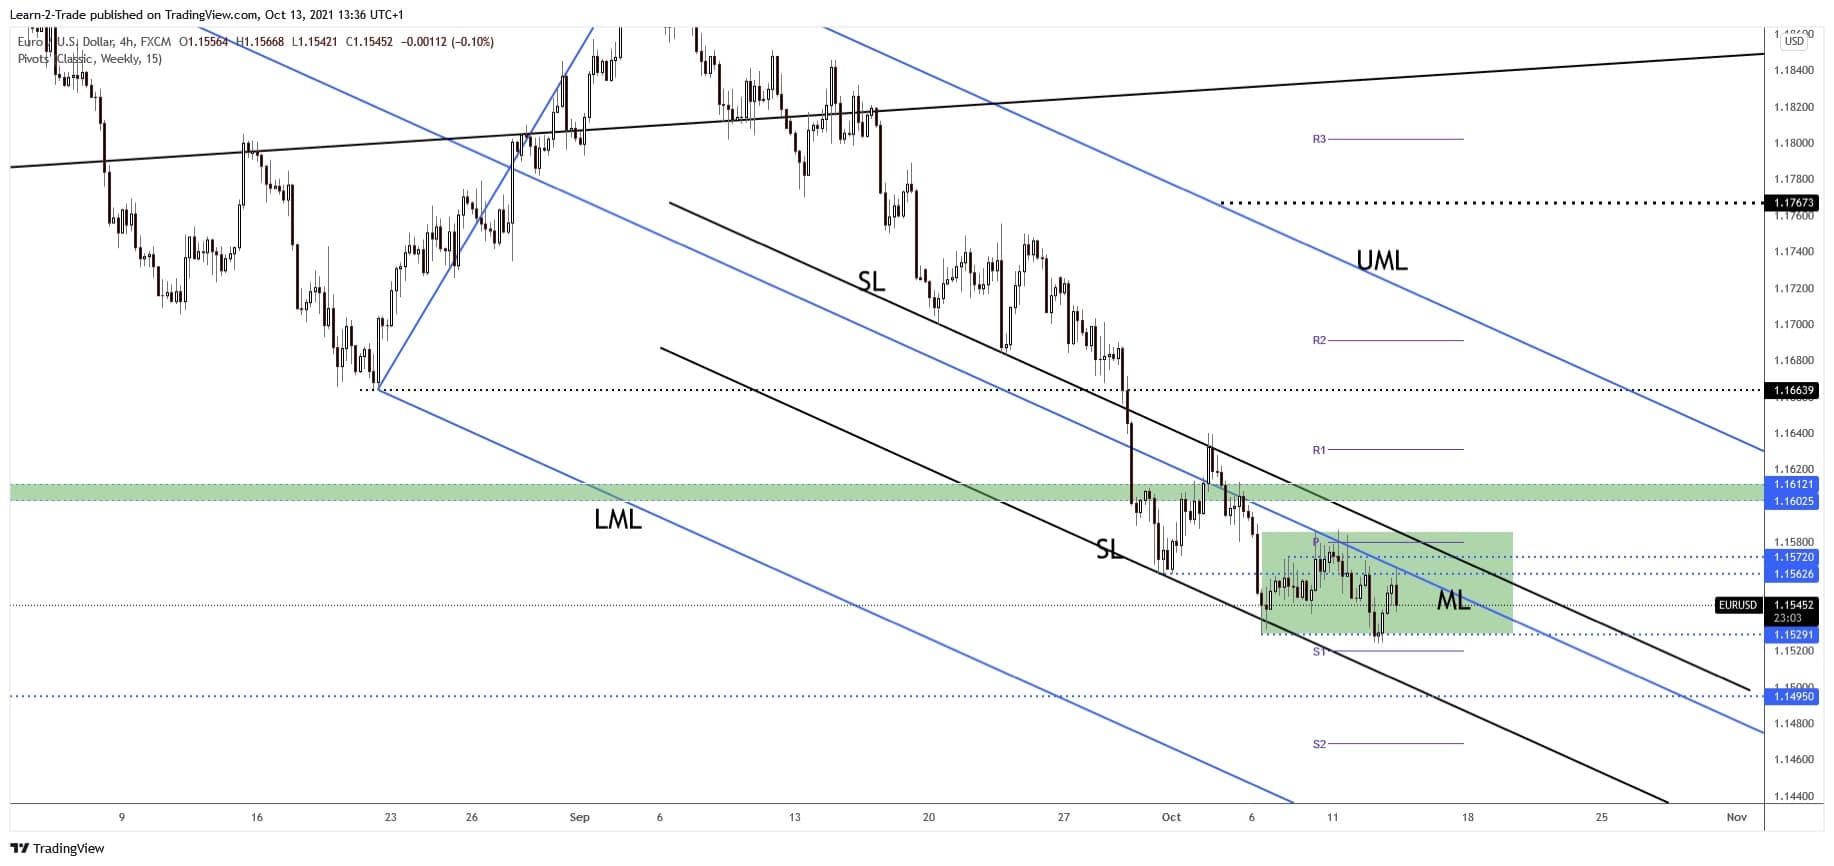
The EUR/USD retested the descending pitchfork’s median line (ml) and now it has dropped again. It’s traded at 1.1545 level below 1.1566 today’s high and above 1.1536 today’s low.
As you already know from my analysis, personally, I believe that the EUR/USD pair is bearish as long as it stays under the median line (ML).
Technically, it’s trapped within a range pattern between 1.1586 and 1.1529 levels. A downside breakout from this range, a new lower low could activate a deeper drop, a downside continuation.
1.1529 is a strong static support. Staying above it and making a valid breakout through the descending pitchfork’s median line (ML) may signal that the downside movement is over. On the other hand, dropping and closing below 1.1524 yesterday’s low may confirm more declines towards the inside sliding line (SL) and down to the 1.1495 static support, historical level.
Looking to trade forex now? Invest at eToro!
67% of retail investor accounts lose money when trading CFDs with this provider. You should consider whether you can afford to take the high risk of losing your money.
