EURUSD Daily Pivots
| R3 | 1.2942 |
| R2 | 1.2851 |
| R1 | 1.2802 |
| Pivot | 1.2711 |
| S1 | 1.2661 |
| S2 | 1.257 |
| S3 | 1.252 |
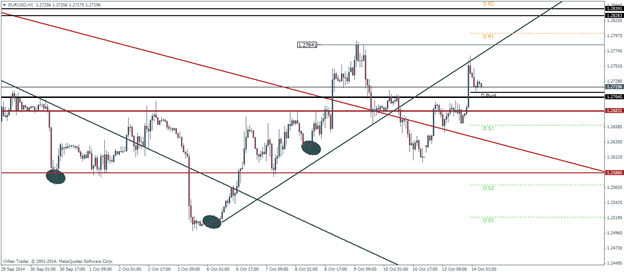
EURUSD, as with most other majors was relatively tight and range based during yesterday’s trading session. The price action however seems to confirm that the complex inverted head and shoulders pattern is indeed valid as price resumed to close above the neckline, paving way for further gains towards 1.2828. Immediate resistance comes in at the previous high at 1.2784
USDJPY Daily Pivots
| R3 | 108.206 |
| R2 | 107.909 |
| R1 | 107.371 |
| Pivot | 107.074 |
| S1 | 106.536 |
| S2 | 106.239 |
| S3 | 105.701 |
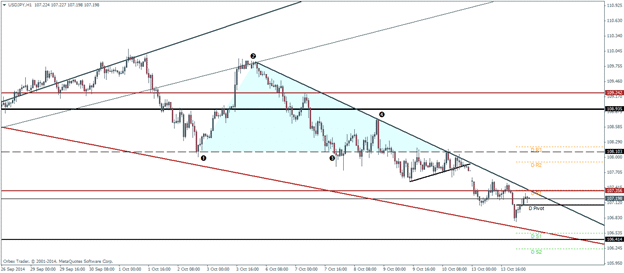
Despite the weekend gap being formed, USDJPY only managed to rally to 107.57 before declining again. The descending triangle’s target is yet to be achieved at 106.4. Current price action looks like USDJPY could test the major support that was broken at 107.356 for resistance before declining towards the final price objective of 106.4. On a larger perspective, from the H4 charts, we also notice a previous unfilled gap at 106.22 levels which the current declines in USDJPY could likely target.
GBPUSD Daily Pivots
| R3 | 1.6199 |
| R2 | 1.6163 |
| R1 | 1.6124 |
| Pivot | 1.6087 |
| S1 | 1.6048 |
| S2 | 1.6012 |
| S3 | 1.5973 |
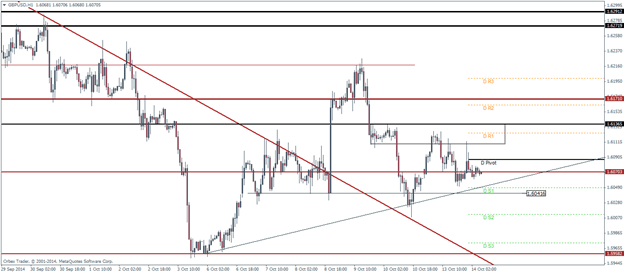
With a quiet trading session yesterday, GBPUSD was trading sideways without any clear direction or bias. We do notice price make a small rally back to test the rectangle breakout zone, testing it for resistance, while forming a minor rising support trend line. There is also a confluence with a previously known support level near 1.60416, which if it holds could see GBPUSD push higher. To the downside, a break of 1.60416 could see a break of the rising support line, which could be tested for resistance, paving way for further declines to test the major long term support/resistance trend line.
