- GBP/JPY clears 23.6% Fibonacci retracement, near the weekly high.
- The latest bounce off multi-week low, RSI recovery favor further recovery.
- Lows marked in November, late-October will return during the downside.
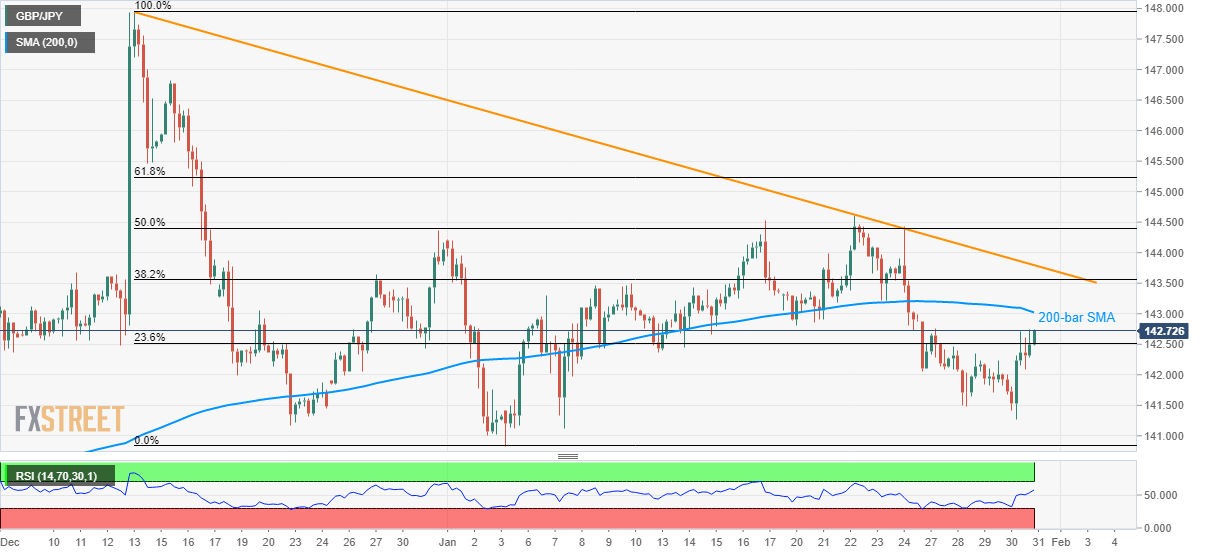
GBP/JPY takes the bids to 142.70 during Friday’s Asian session. The pair recently cleared 23.6% Fibonacci retracement of its fall from December 13 to January 05. Even so, the quote is still below the key upside barriers.
While the recovery in RSI and a sustained break of 23.6% Fibonacci retracement favoring the pair’s run-up, a 200-bar SMA level of 143.00 is likely nearby concern of the buyers.
However, the pair’s further upside will be capped by 38.2% Fibonacci retracement and a falling trend line from December 13, respectively around 143.55 and 143.80.
On the contrary, pair’s declines below 23.6% Fibonacci retracement level of 142.50 can recall 141.70 and the monthly bottom close to 140.80.
During the course of further south-run below 140.80, 140.00 will be important as it holds the key to pair’s drop towards lows marked in November and late-October 2019, around 139.30 and 138.90 respectively.
GBP/JPY four-hour chart
Trend: Further recovery expected
