- GBP/USD daily RSI divergence and extended monthly upside offer downside prospects.
- 4-hour bulls in control until a break of current support.
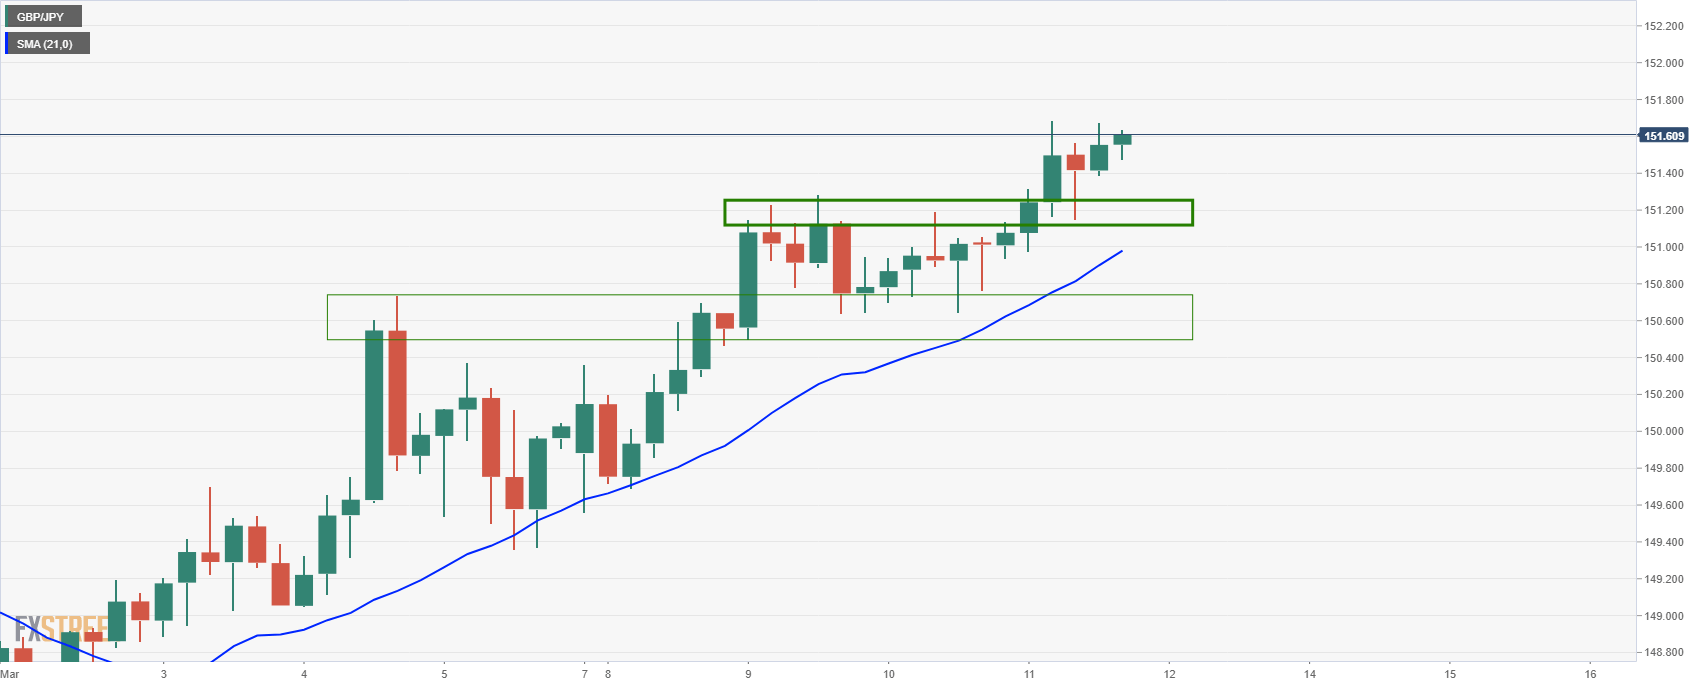
As per the prior analysis, GBP/JPY Price Analysis: Bears eye a 38.2% Fibo retracement zone, the cross has instead extended higher within the monthly bull run and is showing little signs of correcting at this stage, at least according to the 4-hour chart.
Monthly & 4-hour charts
The 4-hour chart below shows that old resistance is now acting as support, so kudos is given to the bulls committing at even such an advance stage in the cycle.
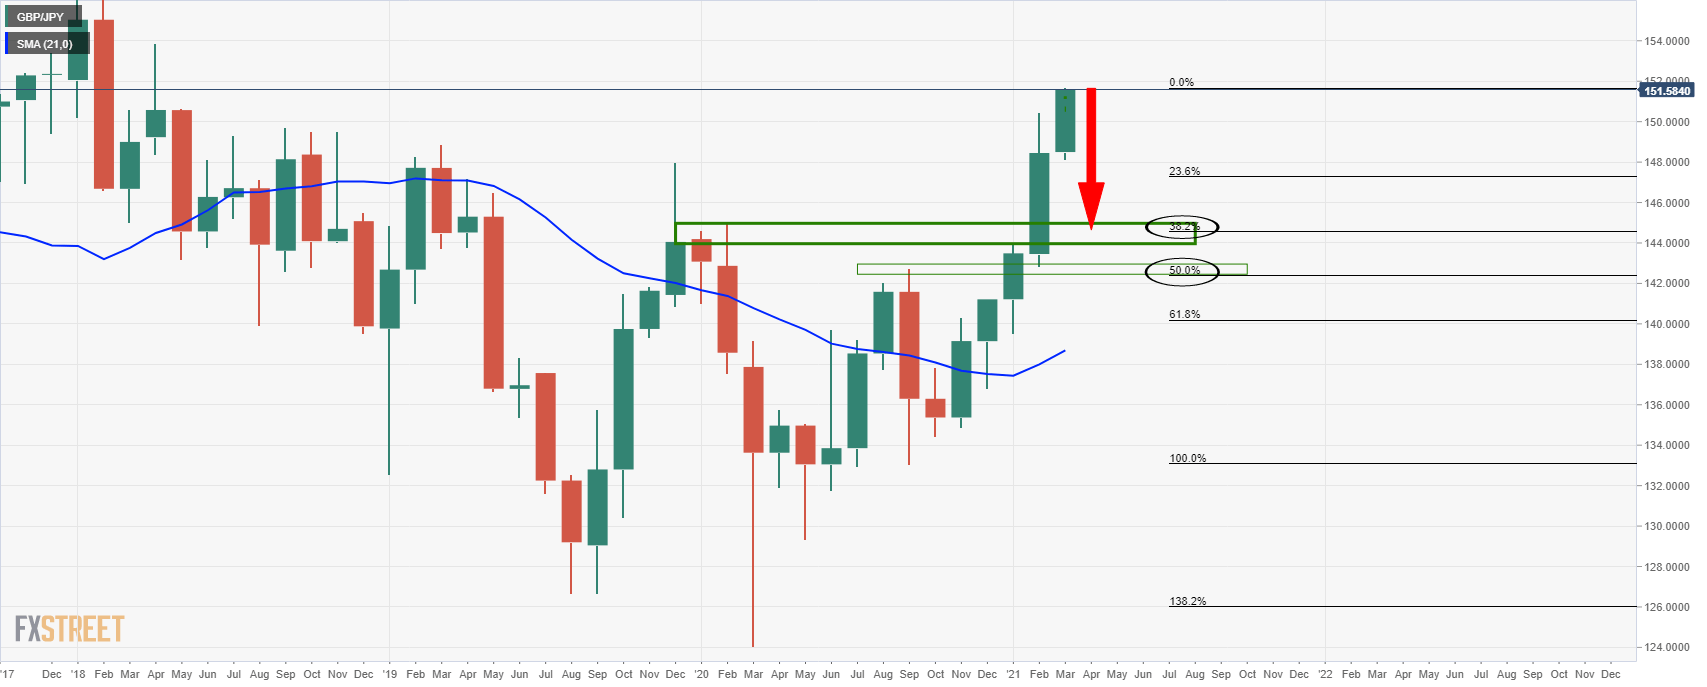
That being said, reaching as high as 151.68, the price is now at a -61.8% Fibonacci retracement of the prior daily correction’s range.
Combined with overbought RSI with some slight bearish divergence, there is now an even more compelling case for a significant correction.
Daily chart
-637510807429031272.png)
4-hour chart
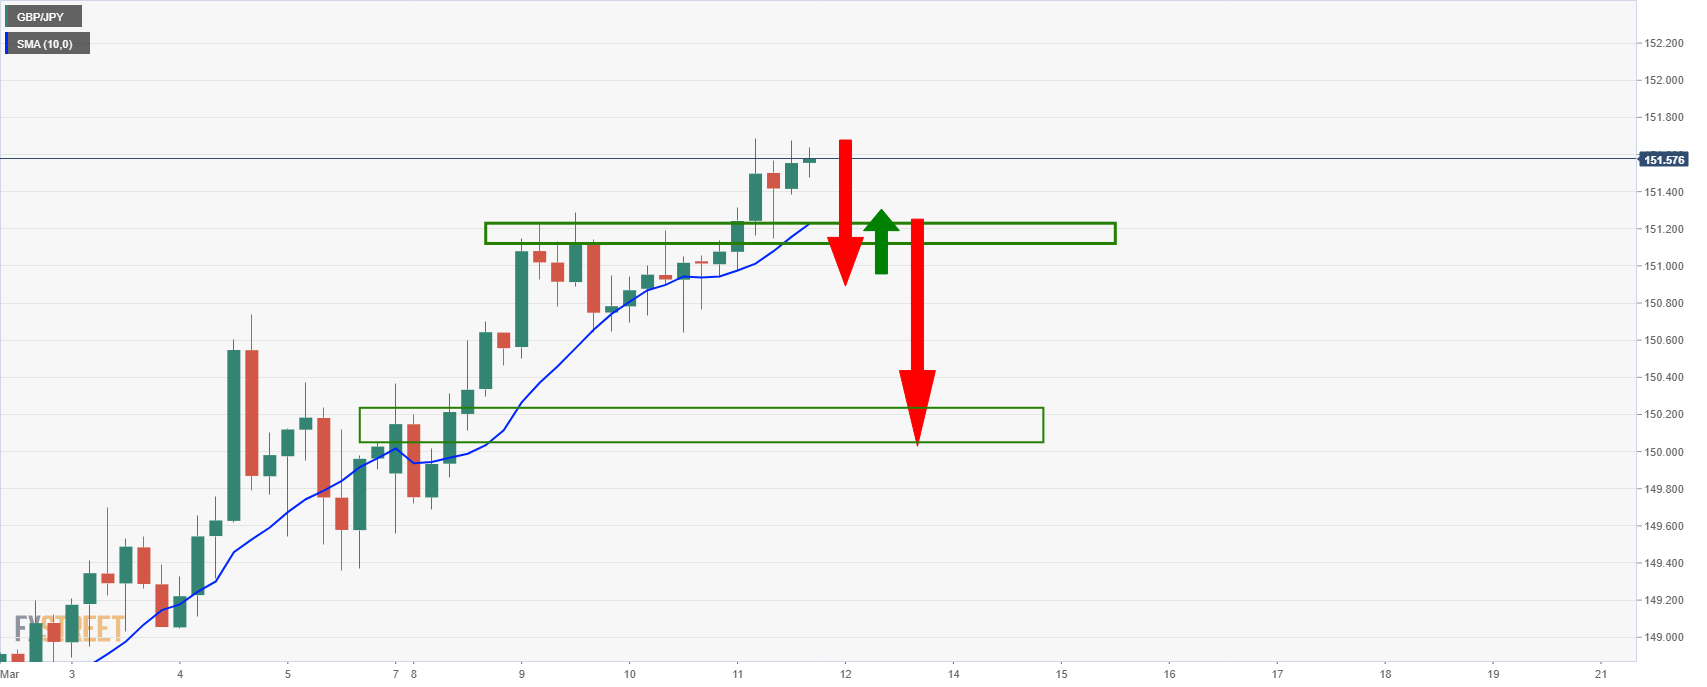
In targeting a downside move, the current support needs to give out to the price.
Breaking the 10-SMA, it would then be expected to act as a resistance structure when combined with prior supporting levels.
