- GBP/JPY bulls in charge to the hourly resistance level.
- Bears seeking a retracement according to the daily chart.
GBP/JPY is on the bid according to the lower time frame,s but there is a risk in banking on the impulse according to the daily chart.
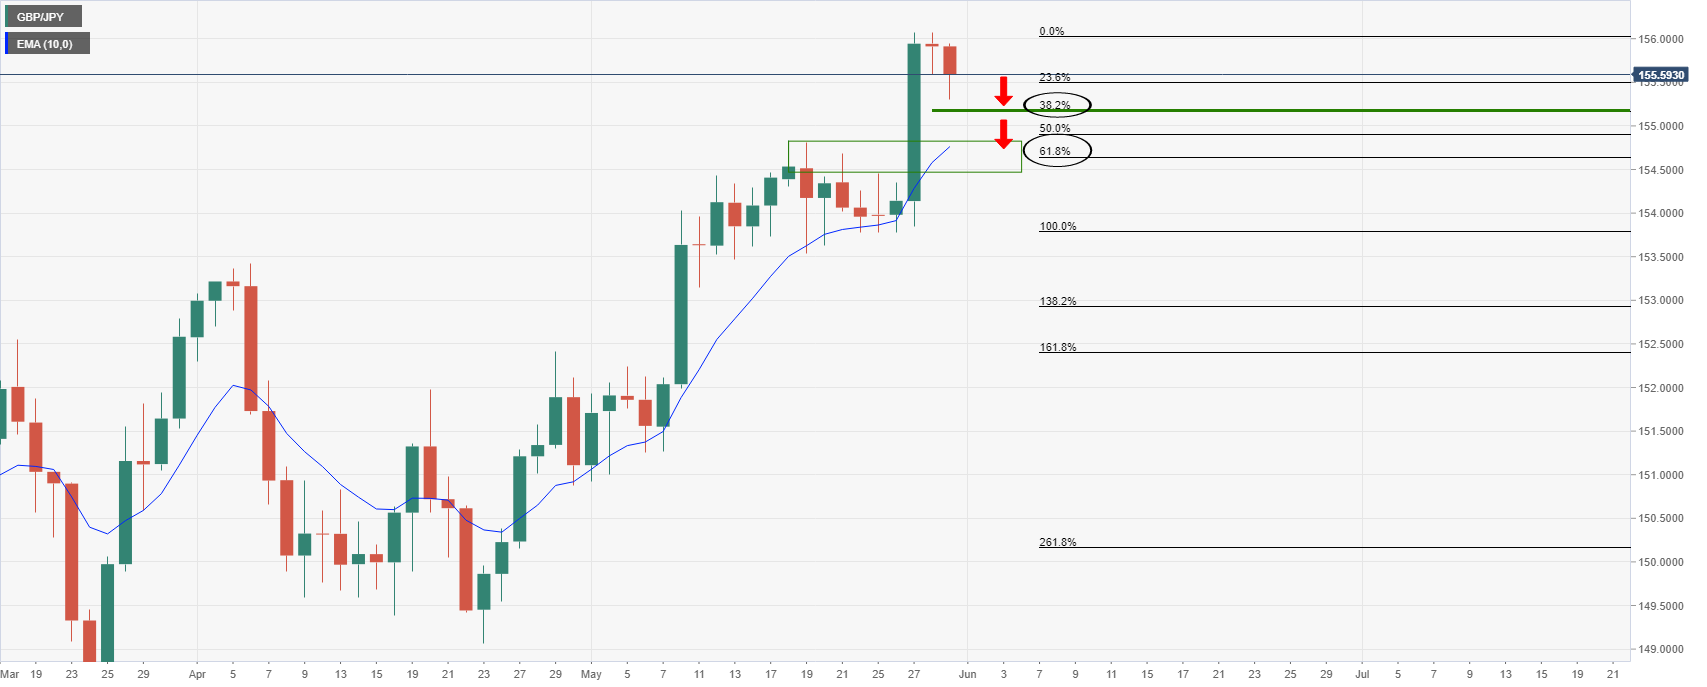
The following illustrates a bearish bias on the daily chart to test to at least the 38.2% Fibonacci retracement level, if not all the way back t the prior highs and a potential support structure that correlates to the 61.8% Fibonacci retracement level.
Daily chart
Hourly chart
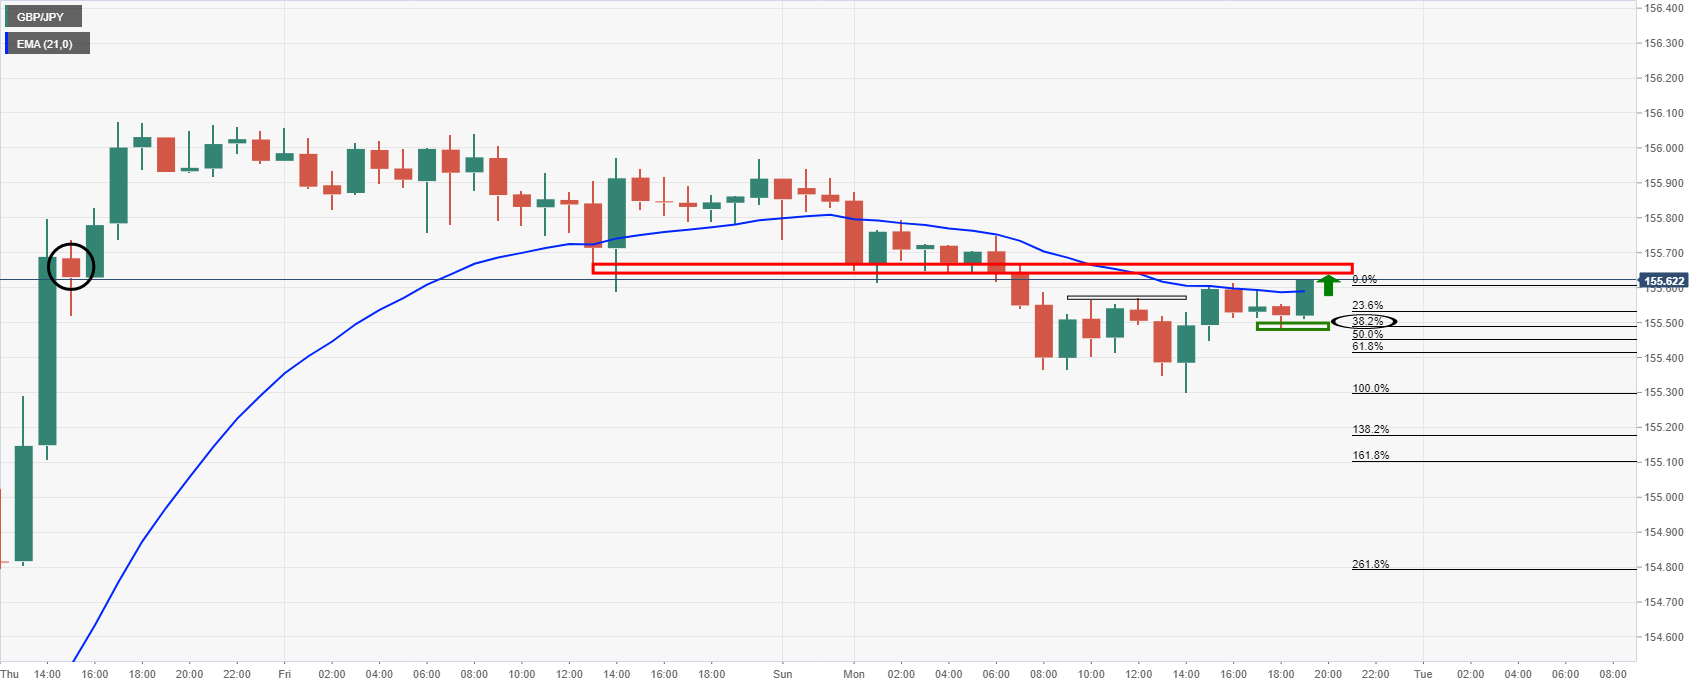
Meanwhile, from a lower time frame perspective, the bulls are focused on the prior liquidity area as identified on the chart above as the price tests above the prior highs, the 21-EMA following a correction to the 38.2% Fibonacci level.
During the time of writing, in fact, the price has already charged and is approaching the resistance target area as seen from the 15-min chart:

