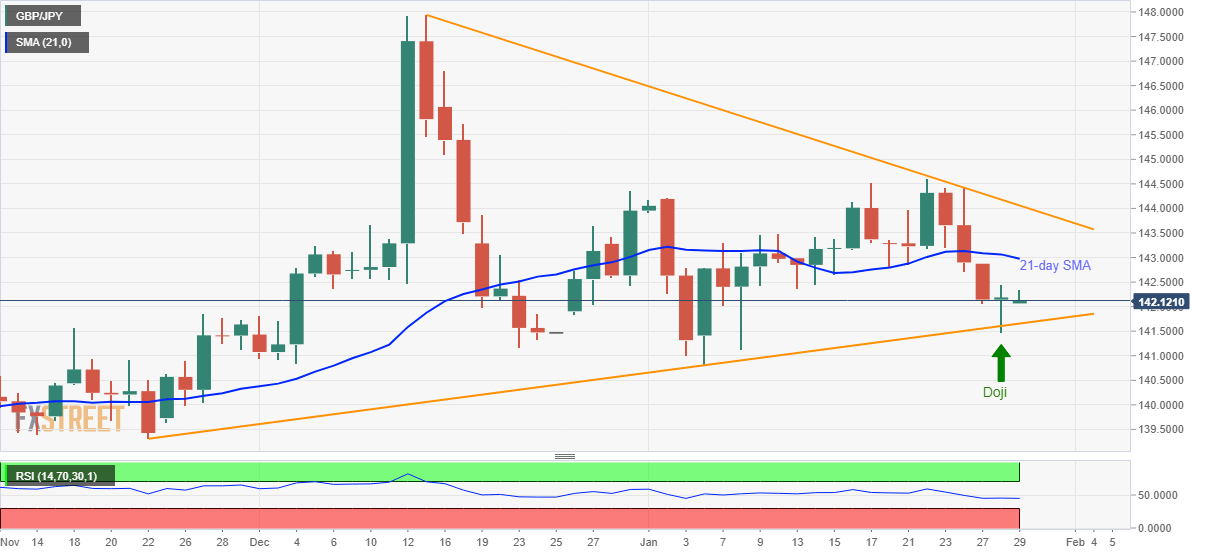
- GBP/JPY bounces off a five-week-old support trend line.
- The bullish candlestick formation could challenge 21-day SMA.
- A downward sloping resistance line stands tall to question the buyers.
GBP/JPY stays mildly bid near 142.10 during Wednesday’s Asian session. The pair recently recovered from a multi-week low while also portraying a bullish candlestick formation on the daily chart.
As a result, buyers could take aim at a 21-day SMA level near 143.00 during the further pullback whereas as a descending trend line from December 13, 2019, around 144.05, will question additional upside.
Should there be a sustained break of 144.05, the monthly top near 144.60 and 145.00 round-figure will lure the optimists.
Meanwhile, a downside break of Tuesday’s low, 141.48, could defy the bullish technical formation and drag the quote closer to 140.00 round-figure.
During the pair’s extended fall beneath 140.00, November 2019 bottom surrounding 139.30 will lure the bears.
GBP/JPY daily chart
Trend: Pullback expected
