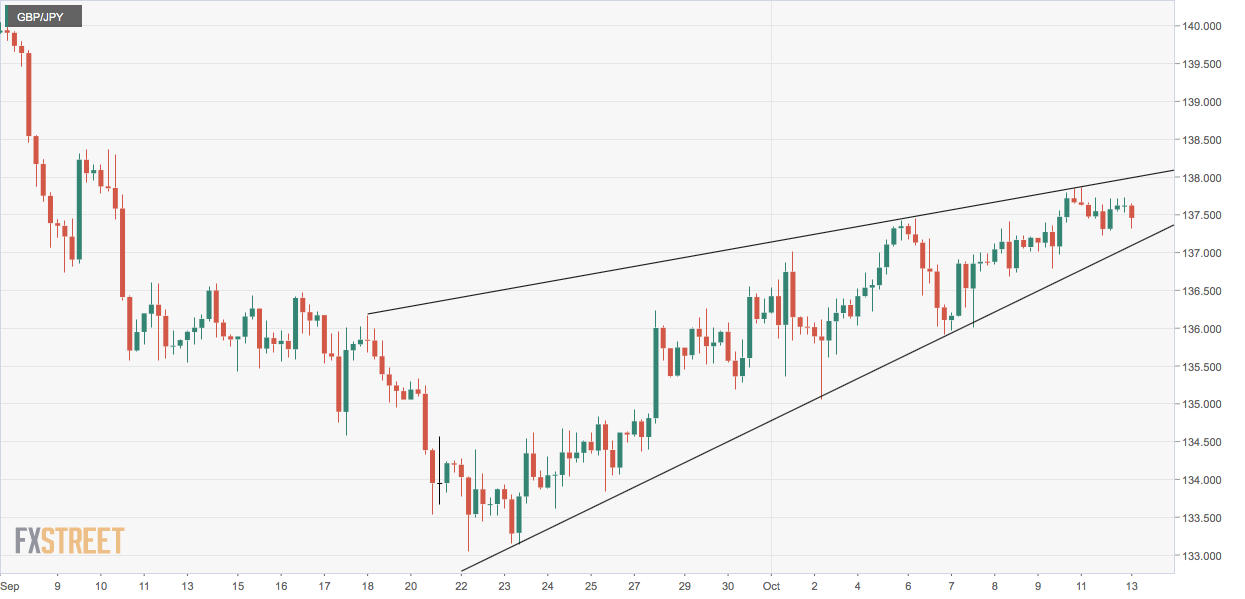
- GBP/JPY has created a rising wedge or bearish reversal pattern on the 4-hour chart.
- A breakdown would shift risk in favor of a re-test of September lows.
GBP/JPY is currently trading in the red near 137.40 at press time, representing a 0.13% decline on the day, having faced rejection at the 50-day simple moving average (SMA) for the second straight trading day on Monday.
The SMA hurdle is now located at 137.78. Meanwhile, the pair has formed a rising wedge or bearish reversal pattern no the 4-hour chart.
A breakdown would mean the bounce from the Sept. 22 low of 133.04 has ended, and the bears have regained control. That would open the doors to the support range of 135.40-135.18.
Alternatively, a close above the 50-day SMA at 137.78 would signal an extension of the recovery rally.
Daily chart
Trend: Bearish
Technical levels
