- GBP/JPY remains under pressure after marking the heaviest losses in more than a month.
- A two-month-old descending triangle support line, 100-day SMA on sellers’ radar.
- An upside clearance of the triangle will refresh the yearly top.
GBP/JPY trades near 141.25 during the Asian session on Tuesday. The pair recently paused after registering the heaviest declines of the year the previous day. Even so, short-term triangle formation and the key SMA could challenge the pair’s further downside.
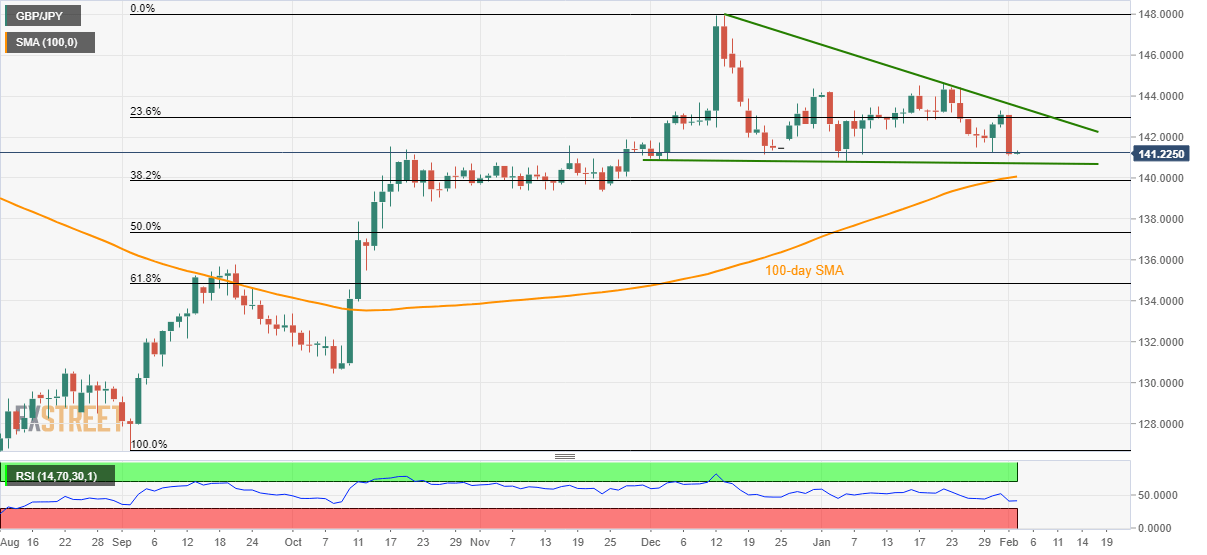
The support line of a descending triangle formation, near 140.85/80, could restrict the pair’s immediate declines ahead of a 100-day SMA level of 140.00.
In a case the bears refrain from respecting the 140.0 round-figure, November 2019 low near 139.30 and October 24 bottom surrounding 138.90 could return to the charts.
On the upside, 23.6% Fibonacci retracement of the pair’s from September to December 2019, at 143.00, will limit the quote’s short-term recovery prior to the triangle’s resistance, at 143.50.
If at all the GBP/JPY prices manage to cross 143.50, the yearly top close to 144.60 will be in question.
GBP/JPY daily chart
Trend: Sideways
