- GBP/JPY fails to extend Friday’s pullback moves from five-week lows.
- Bullish chart pattern has an extra upside barrier around 136.00.
- 61.8% of Fibonacci retracement offers immediate support inside the price-positive formation.
GBP/JPY drops to 135.20, down 0.12% intraday, ahead of Monday’s UK trading session. The pair portrays a bullish chart play, falling wedge, on the four-hour (4H) view amid normal RSI conditions.
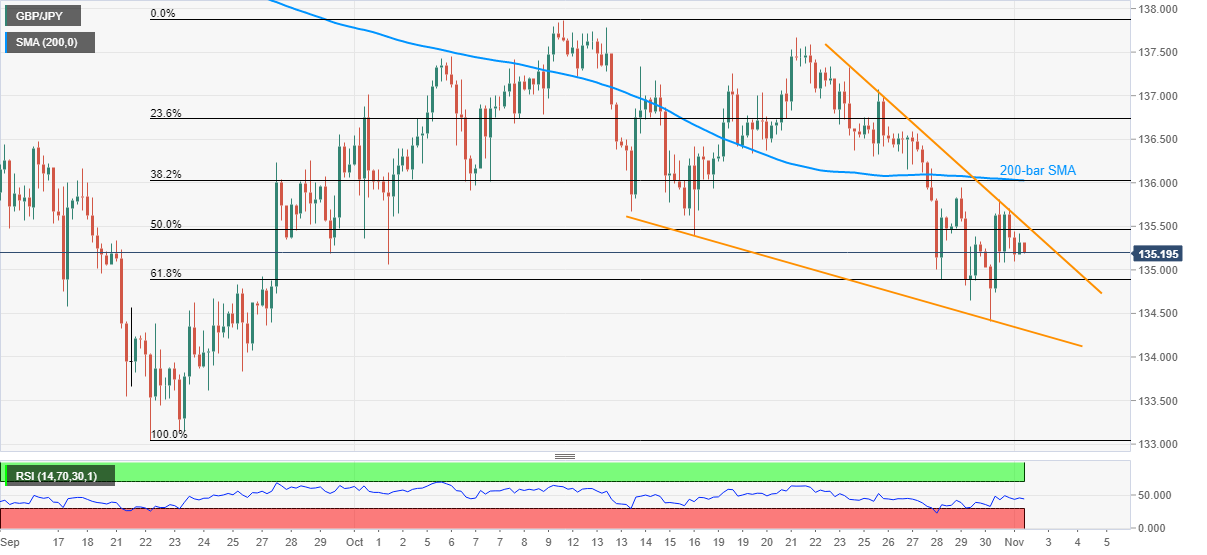
While the early reading of the chart keeps the bulls hopeful once the pair breaks above 135.55 resistance, a confluence of 200-bar SMA and 38.2% Fibonacci retracement of September 22 to October 11 upside, near 136.00, becomes a tough nut to crack for the bulls.
It should, however, be noted that the pair’s ability to cross 136.00 can aim for the previous month’s high close to 137.85 with the 137.00 and 137.70 likely offering intermediate halts during the rise.
Alternatively, a 61.8% Fibonacci retracement level of 134.90 becomes the nearby support ahead of the formation’s lower line, at 134.30 now.
During the quote’s downside past-134.30, September 25 bottom near 133.80 may act as a buffer before directing the GBP/JPY bears toward the September month’s low of 133.04.
GBP/JPY four-hour chart
Trend: Pullback expected
