- GBP/JPY struggles to extend the previous day’s recovery.
- Upbeat RSI, sustained trading beyond 23.6% Fibonacci favor the buyers.
- Sellers will look for entry below January 28 bottom.
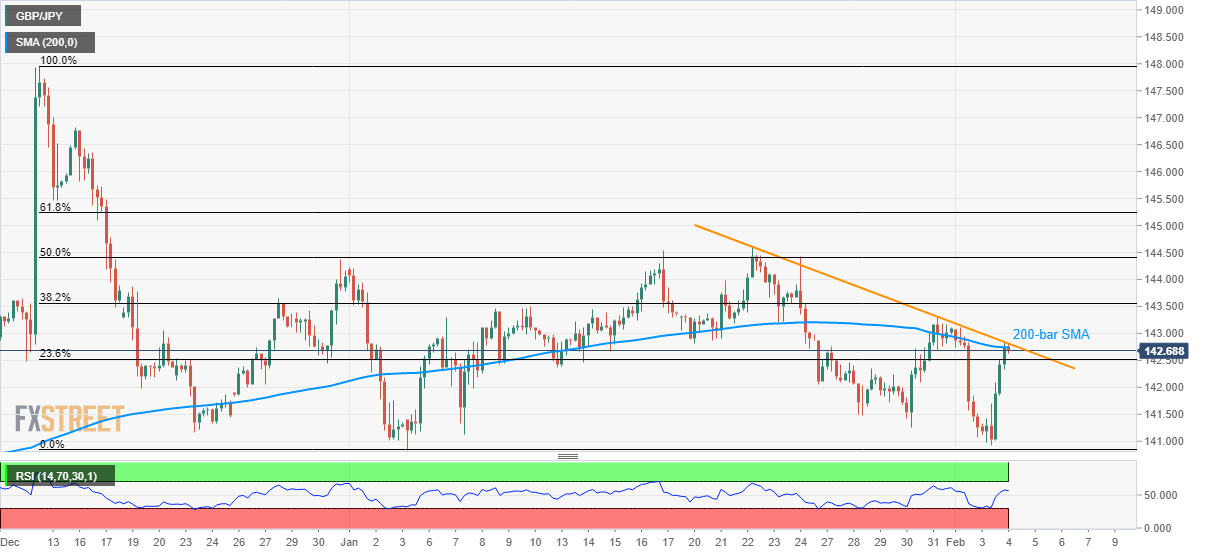
GP/JPY trades around 142.70 during Wednesday’s Asian session. In doing so, the pair probes a two-week-old falling trend line and 200-bar SMA.
The pair’s ability to remain above 23.6% Fibonacci retracement of its declines from December 13, 2019, to January 05, 2020 gains support form positive RSI conditions. As a result, buyers can still be hopeful for a breakout above the key 142.74/82 resistance confluence.
Following that, a 50% Fibonacci retracement level near 144.40 will be the next key resistance to watch ahead of the yearly top surrounding 144.60.
Meanwhile, the pair’s declines below 23.6% Fibonacci retracement level of 142.52 can’t please sellers unless the prices slip beneath January 28 low near 141.50.
That said, the yearly trough around 140.80 and 140.00 psychological magnet could gain the market’s attention during the further weakness.
GBP/JPY four-hour chart
Trend: Further recovery expected
