- GBP/JPY struggles to extend pullback from 136.16 despite bearish candlestick formation on the daily (D1) chart.
- Oversold RSI, strong SMA support probe the bears below 200-day SMA.
- August month’s low adds to the upside barriers.
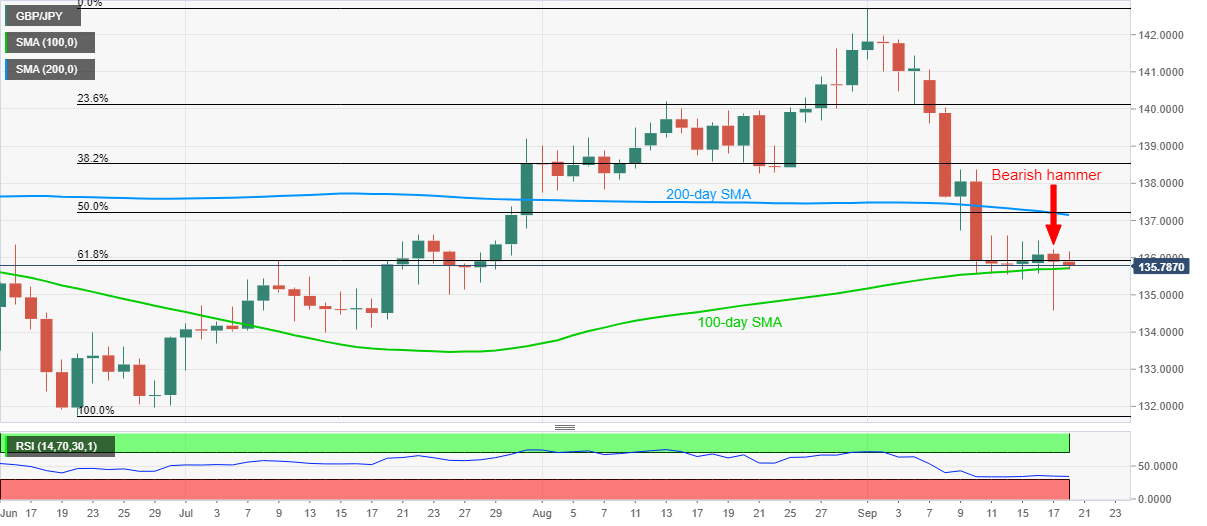
GBP/JPY stays mildly offered around 135.78 ahead of Friday’s London open. In doing so, the pair keeps the sellers hopeful based on a price-negative candlestick pattern as well as sustained trading below 200-day SMA. However, oversold RSI and 100-day SMA questions the quote’s immediate downside.
Other than the 100-day SMA, currently around 135.70, multiple lows marked during the mid-July and June 23 high, near 134.00, also question further selling of GBP/JPY.
If the Pound cross flashes a daily closing below 134.00, odds of its slump to June month’s bottom surrounding 131.75 can’t be ruled out.
Meanwhile, the 61.8% Fibonacci retracement level of June-September upside, near 135.95 offers immediate resistance to the pair ahead of the previous day’s top near 136.25.
On the D1 close above 136.25, GBP/JPY defies the bearish candlestick formation, which in turn enables it to target the 137.15/25 resistance confluence including 200-day SMA and 50% Fibonacci retracement.
Though, bulls will remain cautious unless breaking August month’s trough close to 137.75.
GBP/JPY daily chart
Trend: Pullback expected
