- GBP/JPY bounces off an intraday low of 135.56 but prints mild losses on a daily chart.
- Bearish MACD, sustained break of a four-month-old ascending trend line keeps the sellers hopeful.
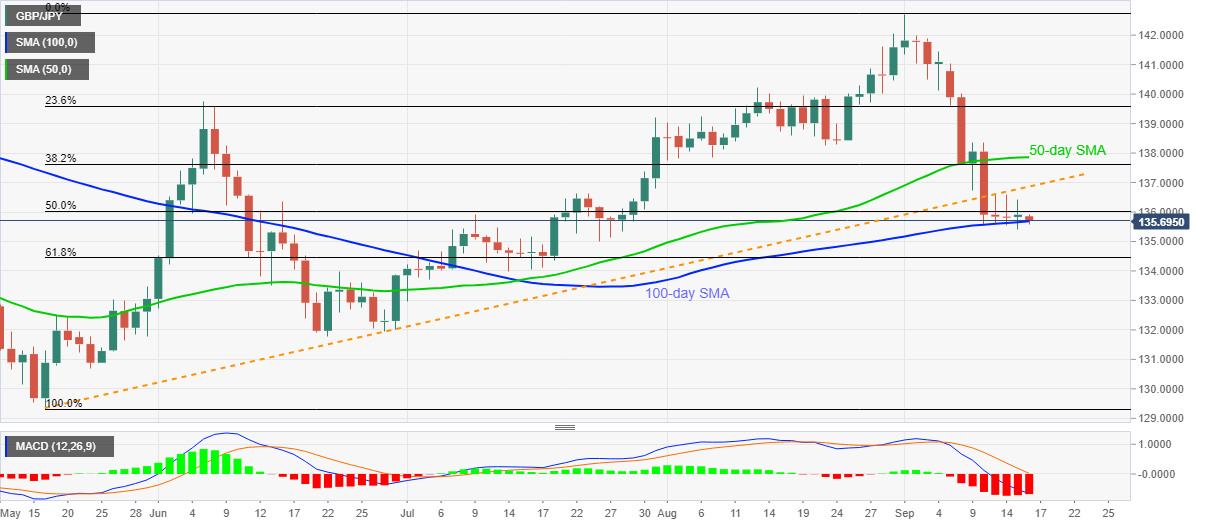
- 50-day SMA adds to the upside barrier, 61.8% of Fibonacci retracement on the bears’ radars.
GBP/JPY marks another U-turn from 100-day SMA while taking rounds to 135.70/65 during Wednesday’s Asian session. Even so, the pair’s weakness after breaking an upward sloping trend line from May 18, coupled with the bearish MACD, suggests the quote’s further downside.
As a result, fresh selling may wait for a daily closing past-100-day SMA level of 135.68. In doing so, the bears may target 61.8% Fibonacci retracement of the pair’s May-September upside around 134.44.
Though, the July 24 bottom near 135.00 may offer intermediate halts during the GBP/JPY fall.
Alternatively, an upside clearance of the multi-day-old resistance line, previous support, around 136.85 will need to cross the 50-day SMA level of 137.85 to convince the buyers.
Also acting as upside barriers are the August 21 low of 138.25 and the June month’s top close to 139.75.
GBP/JPY daily chart
Trend: Bearish
