- GBP/JPY extends pullback from the monthly top, slips below short-term key SMA.
- Lows marked in December 20019, January 2020 will be the keys to watch.
- 50% of Fibonacci retracement limits near-term upside.
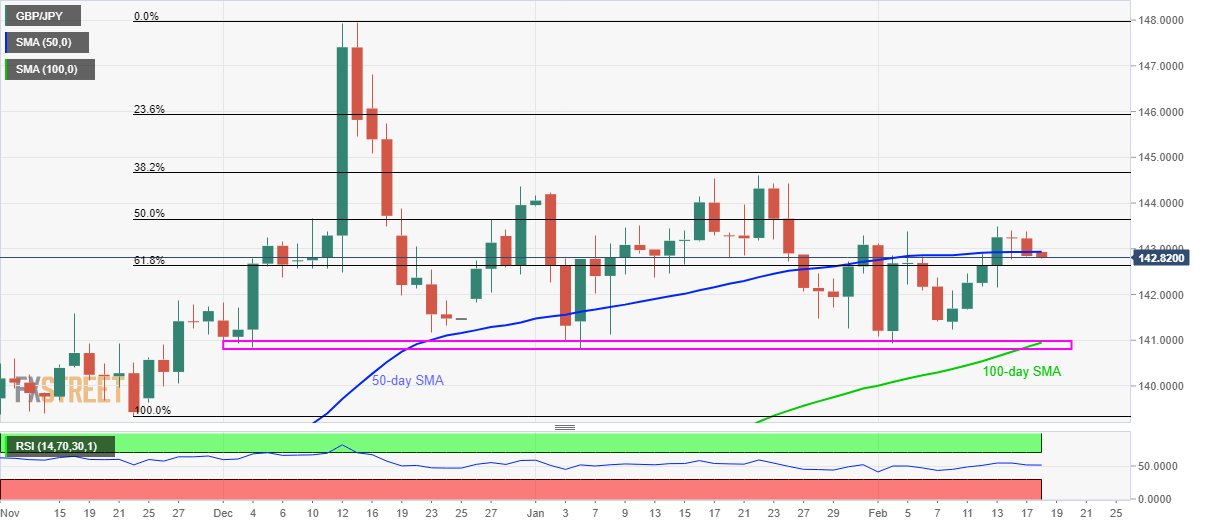
GBP/JPY extends losses to 142.82 during Tuesday’s Asian session. In doing so, the pair keeps trading below 50-day SMA while targeting 61.8% Fibonacci retracement of November-December 2019 upside.
If the pair keeps its negative tone below the immediate support level of 142.60, its drop to 141.00 can’t be ruled out.
However, lows marked during December 20019 and January 2020, coupled with 100-day SMA, could restrict the pair’s further declines 141.0-140.80.
On the upside, 50% and 38.2% Fibonacci retracement levels near 143.65 and 144.70 will restrict the pair’s recovery beyond a 50-day SMA level of 142.95.
If bulls dominate past-144.70, 145.40 and 146.00 will act as buffers to the late-2019 top close to 148.00
GBP/JPY daily chart
Trend: Bearish
