- GBP/JPY remains on the front foot after clearing 21-DMA amid bullish MACD.
- 23.6% Fibonacci retracement, three and a half month long falling trend-line limit the upside.
While a sustained break of 21-day simple moving average (DMA) portrays the GBP/JPY pair’s weakness amid bullish MACD signal, the quote still remains below key resistance-confluence while trading near 130.00 during early Wednesday morning in Asia.
As a result, chances of the pair’s pullback to 21-DMA level of 129.20 can’t be denied. However, its further declines will be challenged by a two-week-old rising trend-line near 128.50.
In a case where prices keep trading southwards past-128.50, monthly bottom close to 126.50 gains sellers’ attention.
Should the bullish signal by the 12-bar moving average convergence and divergence (MACD) helps buyers to overcome 131.30/35 confluence, comprising 23.6% Fibonacci retracement of pair’s May-August downpour and a descending trend-line since early May, they can aim for July 30 high near 133.10 and July 17 bottom around 134.00 during further upside.
GBP/JPY daily chart
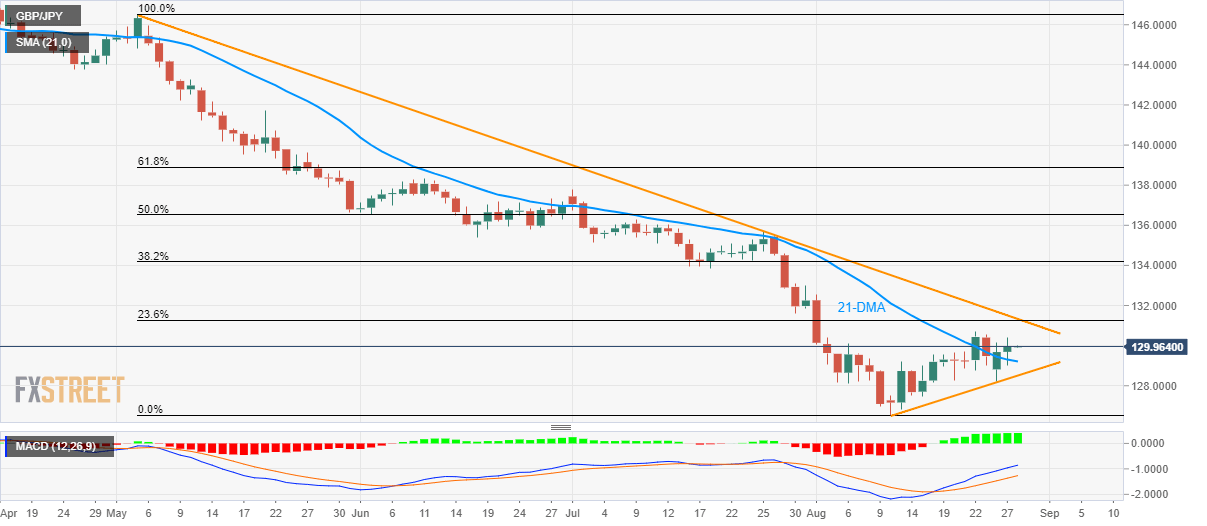
Trend: Pullback expected
