- GBP/JPY follows a range between 38.2% Fibonacci retracement and 133.60/65 resistance-confluence.
- 50/100-bar SMA and 23.6% Fibonacci retracement restrict upside.
- 200-bar SMA becomes key downside support.
Despite trading modestly in the positive territory since the week start, GBP/JPY is yet to confront key upside barrier as it takes rounds to 132.80 during Tuesday’s Asian session.
The 133.60/65 confluence region, comprising 50 and 100-bar simple moving average together with 23.6% Fibonacci retracement of September month advances, restrict pair’s upside.
Should prices rally beyond 133.65, 134.60 and 135.20/25 can entertain buyers ahead of highlighting previous month top of 135.75.
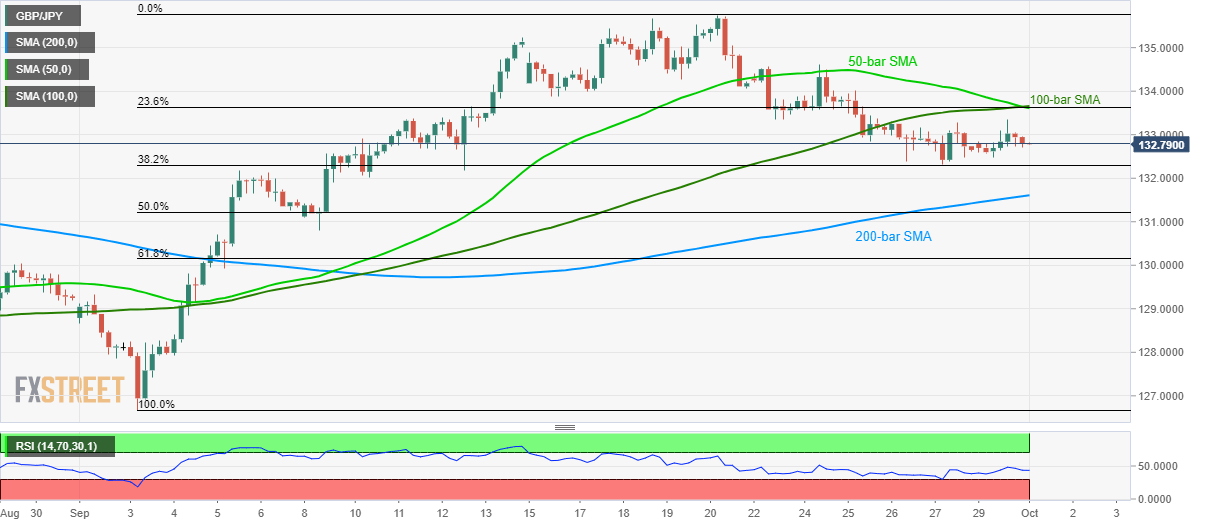
Meanwhile, 38.2% Fibonacci retracement level of 132.30 can act as immediate support before dragging the quote to 200-bar SMA level of 131.60.
GBP/JPY 4-hour chart
Trend: sideways
