- Five-month-old horizontal-line limits immediate upside.
- 61.8% Fibonacci retracement and multiple lows during January may please sellers.
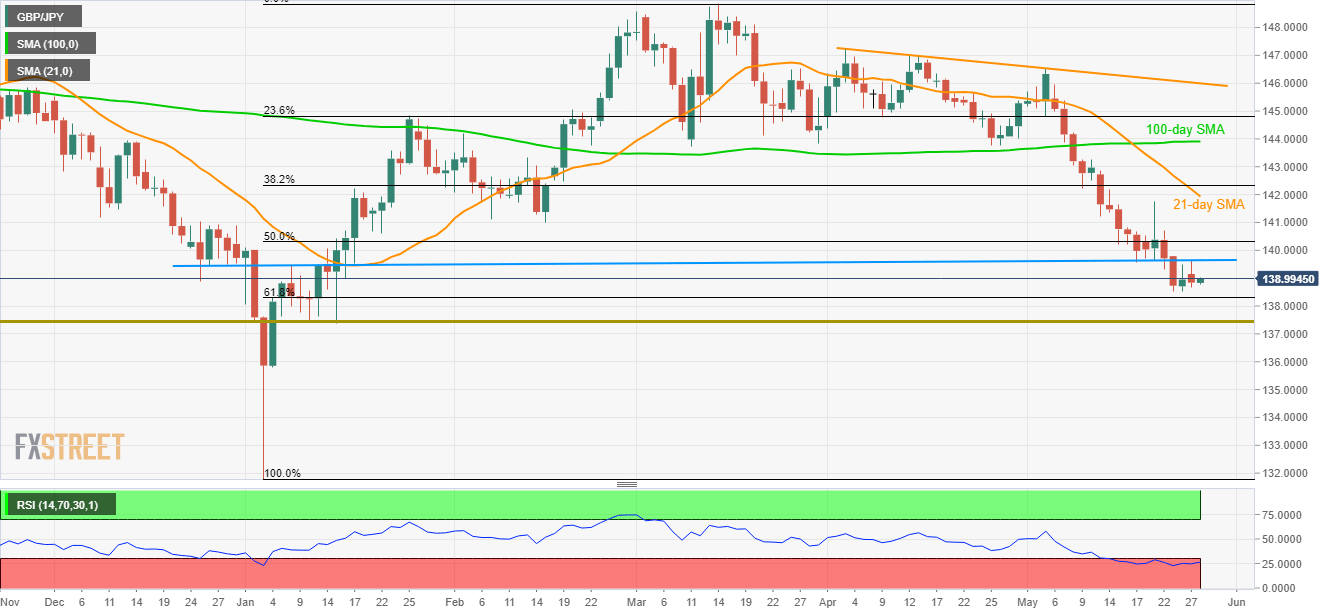
Having portrayed a pullback from near-term important horizontal-line resistance, the GBP/JPY pair is trading close to 139.00 during the early Asian session on Tuesday.
61.8% Fibonacci retracement of January to March upside, at 138.30 may act as immediate support during the pair’s decline while multiple lows since early January near 137.45/35 could question additional downside.
If sellers refrain from respecting 137.35 rest-point, January 04 low at 135.80 seems crucial to watch.
On the flipside, a sustained break of the horizontal-line stretched since late-2018 near 139.60/70 can keep limiting the pair’s near-term advances.
Should there be an uptick beyond 139.70, 140.00 round-figure and 50% Fibonacci retracement near 140.32 can act as intermediate halts during the rise towards 21-day simple moving average (SMA) near 141.93.
GBP/JPY daily chart
Trend: Bearish
