- GBP/JPY has met hourly resistance at 147.99 (R2), posting a NY session high of 148.05, so far.
- Hourly and daily RSI popped above 70 and hourly MACD is turning lower also.
- ATR is 1.3408, and the daily range, so far, is between a low of 146.15 and 148.05,(or 1.9000), somewhat higher than the ATR and signifies an exhausted top-side move.
- However, the Chikou Span (Lagging Span) remains very distant from price, (bullish) although the shorter-term Tenken line looks set to cross below the Kijun (neutral/less bullish) at this juncture.
- A period of consolidation is likely before a further upside more to target the early Nov swing highs at 149.48 – (daily MACD also offers the potential for further upside).
- 147.09 would be a 50% retrecament of the move from the daily lows to recent swing highs where bulls might wish to enter longs for further upside potential. Conversely, a break of 147.00 would target the daily pivot at 146.34 and then S1 located at 145.63.
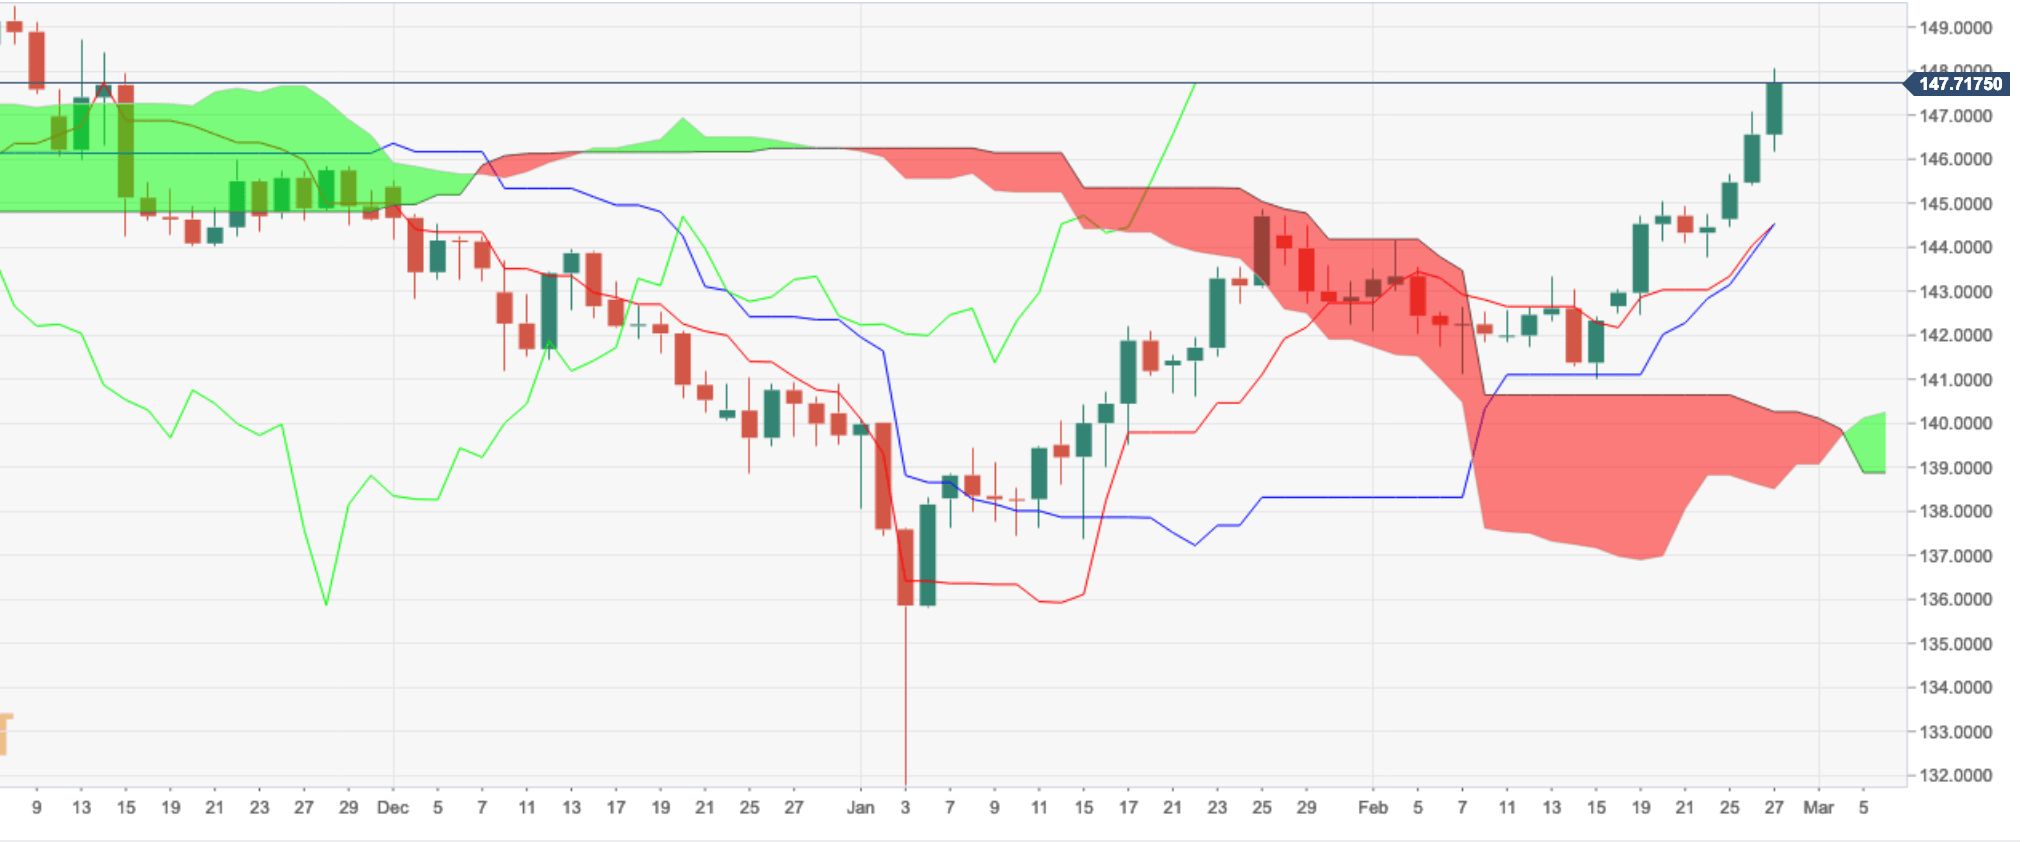
GBP/JPY daily chart
