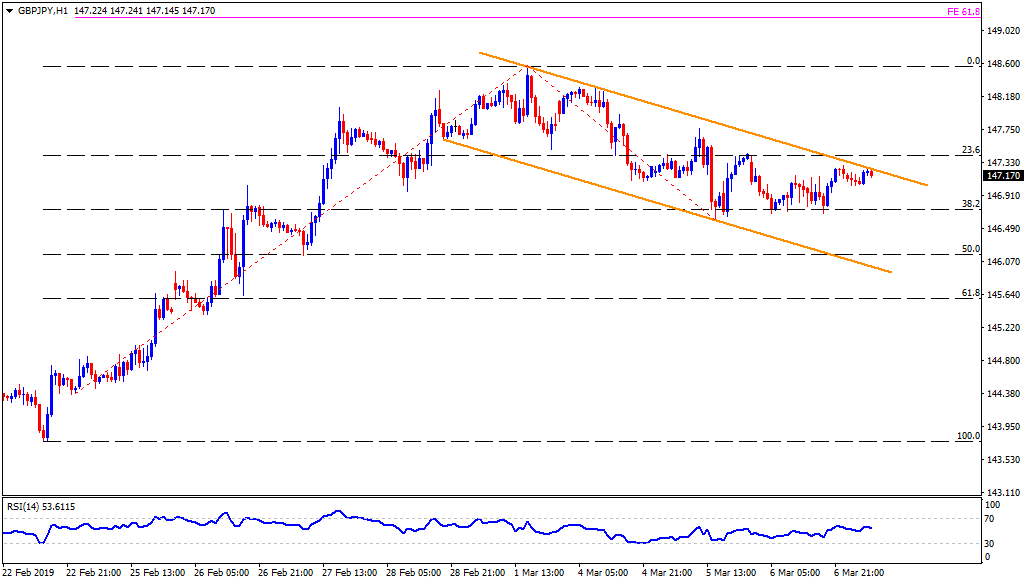
- GBP/JPY trades near 147.15 during early Thursday.
- The quote took a U-turn from upper-line of a weeklong downward sloping trend-channel, at 147.25, which in-turn signal brighter chances of its pullback to 147.00.
- However, 38.2% Fibonacci retracement of its February 22 to March 01 moves, at 146.70, could limit the declines, if not then 146.40 and channel support figure of 146.00 might grab the spotlight.
- If at all prices rally beyond 147.25, 148.00 and 148.30 may appear on the chart.
- During the pair’s additional increase past-148.30, current month high near 148.55 and 61.8% Fibonacci expansion (FE) level, at 149.20, can lure the buyers.
GBP/JPY hourly chart
Additional important levels:
Overview:
Today Last Price: 147.18
Today Daily change: -9 pips
Today Daily change %: -0.06%
Today Daily Open: 147.27
Trends:
Daily SMA20: 144.66
Daily SMA50: 142.38
Daily SMA100: 143.46
Daily SMA200: 144.67
Levels:
Previous Daily High: 147.48
Previous Daily Low: 146.69
Previous Weekly High: 148.58
Previous Weekly Low: 144.46
Previous Monthly High: 148.28
Previous Monthly Low: 141.01
Daily Fibonacci 38.2%: 146.99
Daily Fibonacci 61.8%: 147.18
Daily Pivot Point S1: 146.81
Daily Pivot Point S2: 146.36
Daily Pivot Point S3: 146.03
Daily Pivot Point R1: 147.6
Daily Pivot Point R2: 147.93
Daily Pivot Point R3: 148.38
