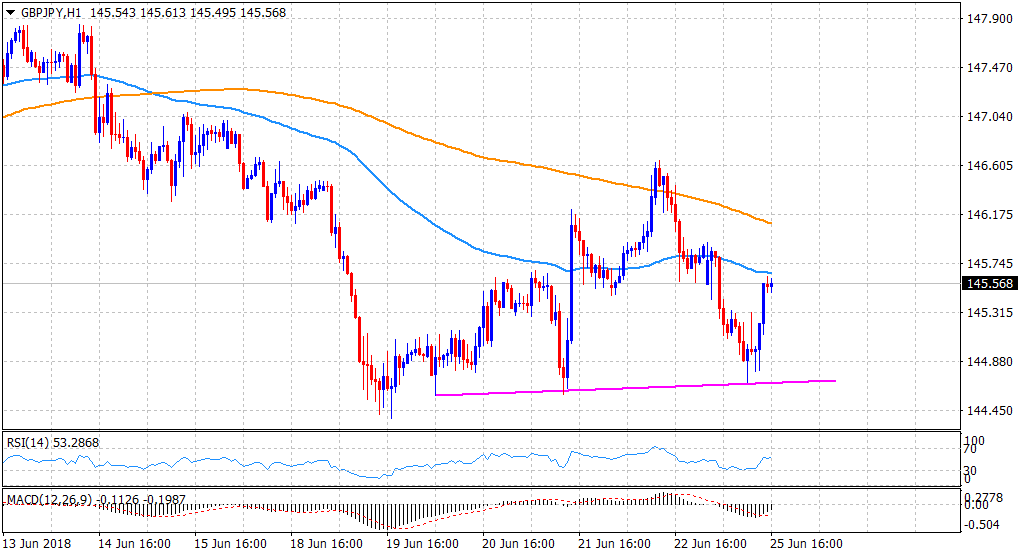
“¢ Rebound from the pre-BoE strong horizontal support and jumps back to test 100-hour EMA, albeit lacked any strong follow-through.
“¢ Mixed technical indicators fail to support any firm directional bias and hence, any subsequent up-move is likely to confront strong hurdle near 200-day SMA.
“¢ A decisive break below 144.70 horizontal support would negate prospects for any near-term up-move and turn the cross vulnerable to slide further.
Current Price: 145.57
Daily High: 145.93
Daily Low: 144.70
Trend: Neutral
Resistance
R1: 145.94 (static resistance)
R2: 146.11 (200-period SMA H1)
R3: 146.65 (post-BoE swing high)
Support
S1: 145.35 (S1 daily pivot-point)
S2: 145.00 (psychological round figure mark)
S3: 144.70 (current day swing low)
