- GBP/JPY remains below 21/50-day EMA confluence.
- Doji candlestick formation and bearish MACD increase the odds of additional weakness.
Not only failure to cross key EMA confluence, but Doji candle on the daily chart also portrays the GBP/JPY weakness as it takes rounds to 131.90 amid initial Asian trading session on Friday.
The bearish Doji candlestick formation after Thursday’s closing on a daily chart strengthens the downward supporting signals from the 12-bar moving average convergence and divergence (MACD) indicators.
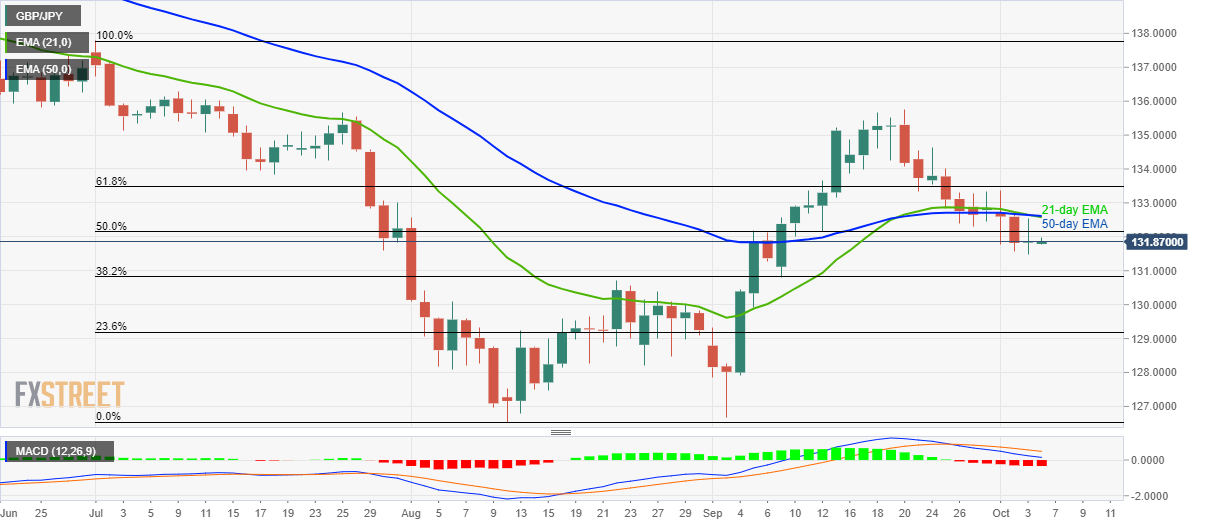
As a result, the pair is now likely to visit 130.80/70 area including 38.2% Fibonacci retracement of July-August declines and late-August top. However, its further downside could highlight 130.00 and 128.30 as the key supports.
Alternatively, pair’s run-up beyond the confluence of 21-day and 50-day exponential moving averages (EMAs) surrounding 132.60/65, can trigger fresh recovery to 61.8% Fibonacci retracement level near 133.50.
It should, however, be noted that 134.30 holds the key to pair’s rally past-133.50.
GBP/JPY daily chart
Trend: bearish
