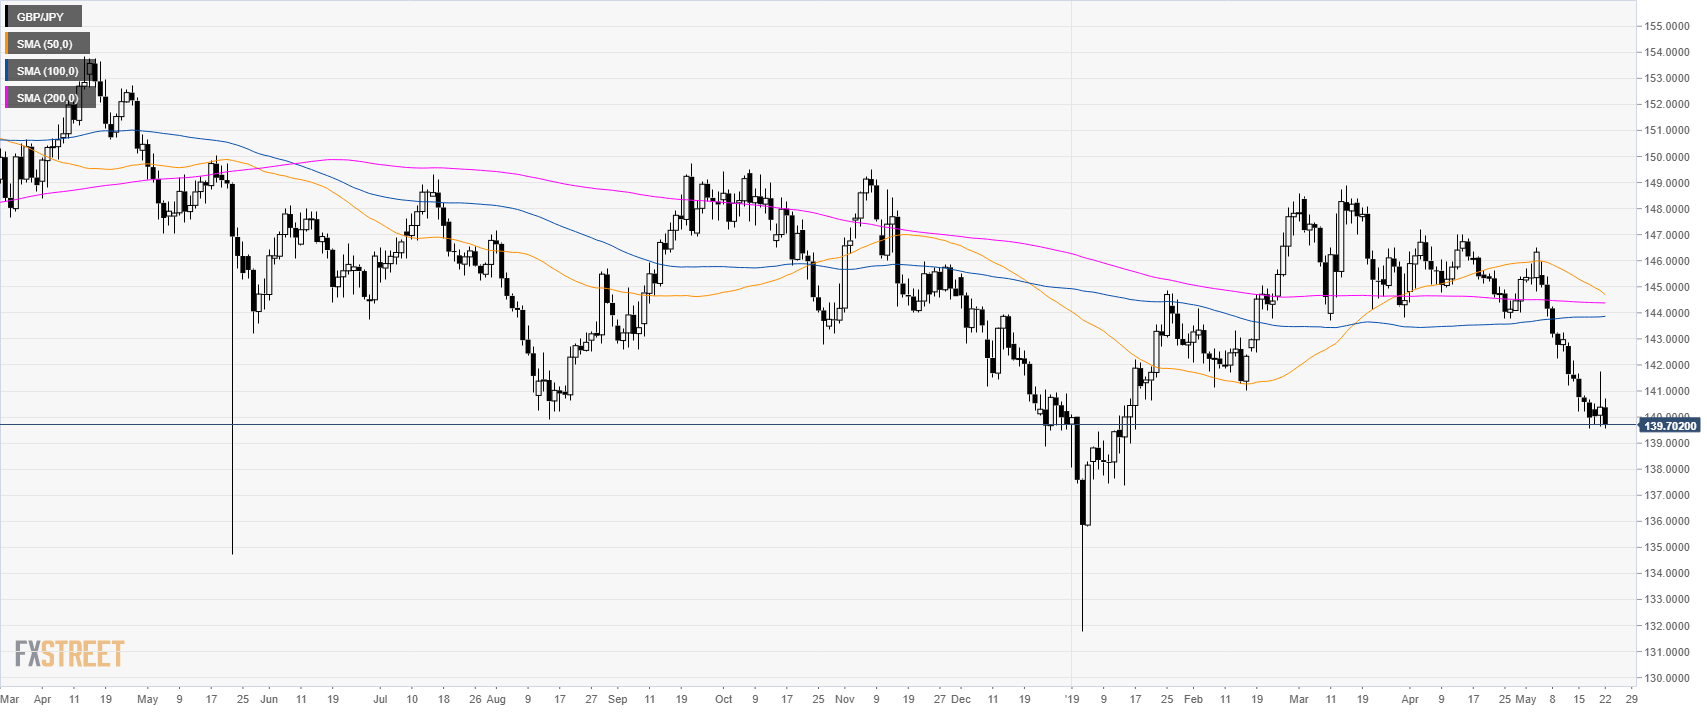
GBP/JPY daily chart
GBP/JPY is trading in a bear trend below its main simple moving averages (SMAs).
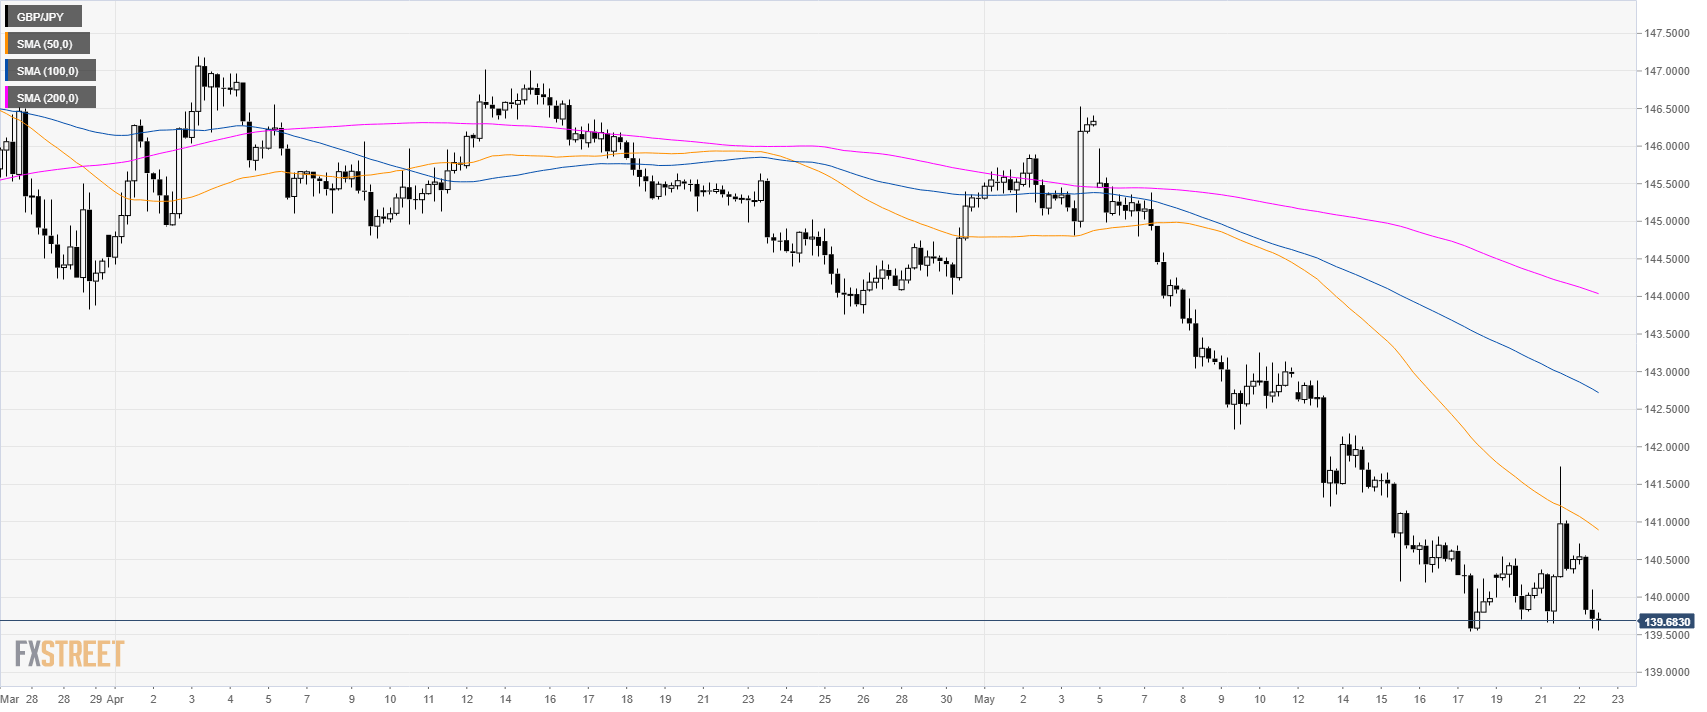
GBP/JPY 4-hour chart
GBP/JPY erased the Brexit-related news seen on Tuesday.
GBP/JPY 30-minute chart
GBP/JPY is trading below its main SMAs suggesting bearish momentum. A break below 139.60 support can lead to 139.00 and 138.50 level to the downside. Resistances are seen at 140.65 and 141.70 levels.
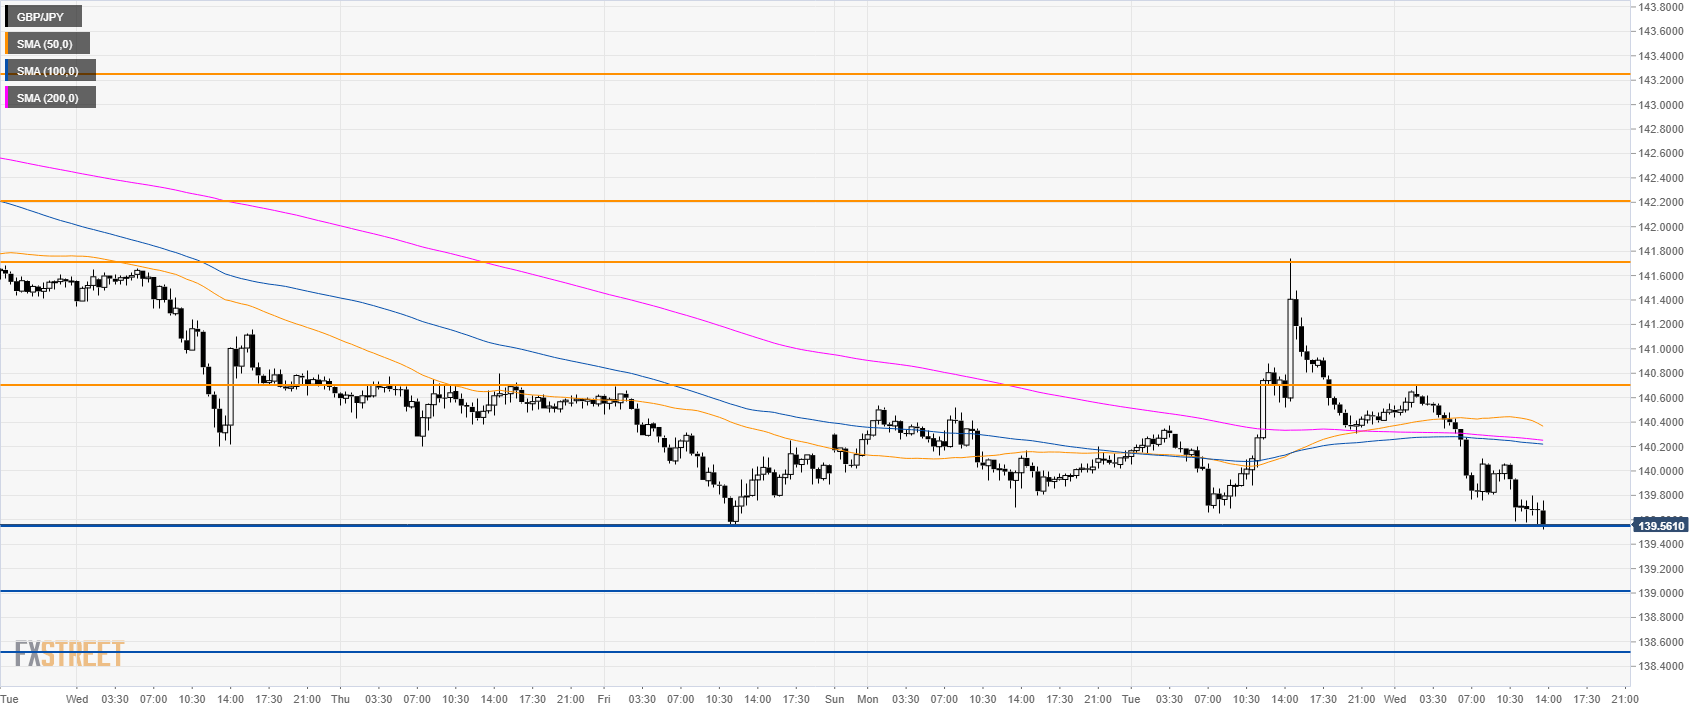
Additional key levels
