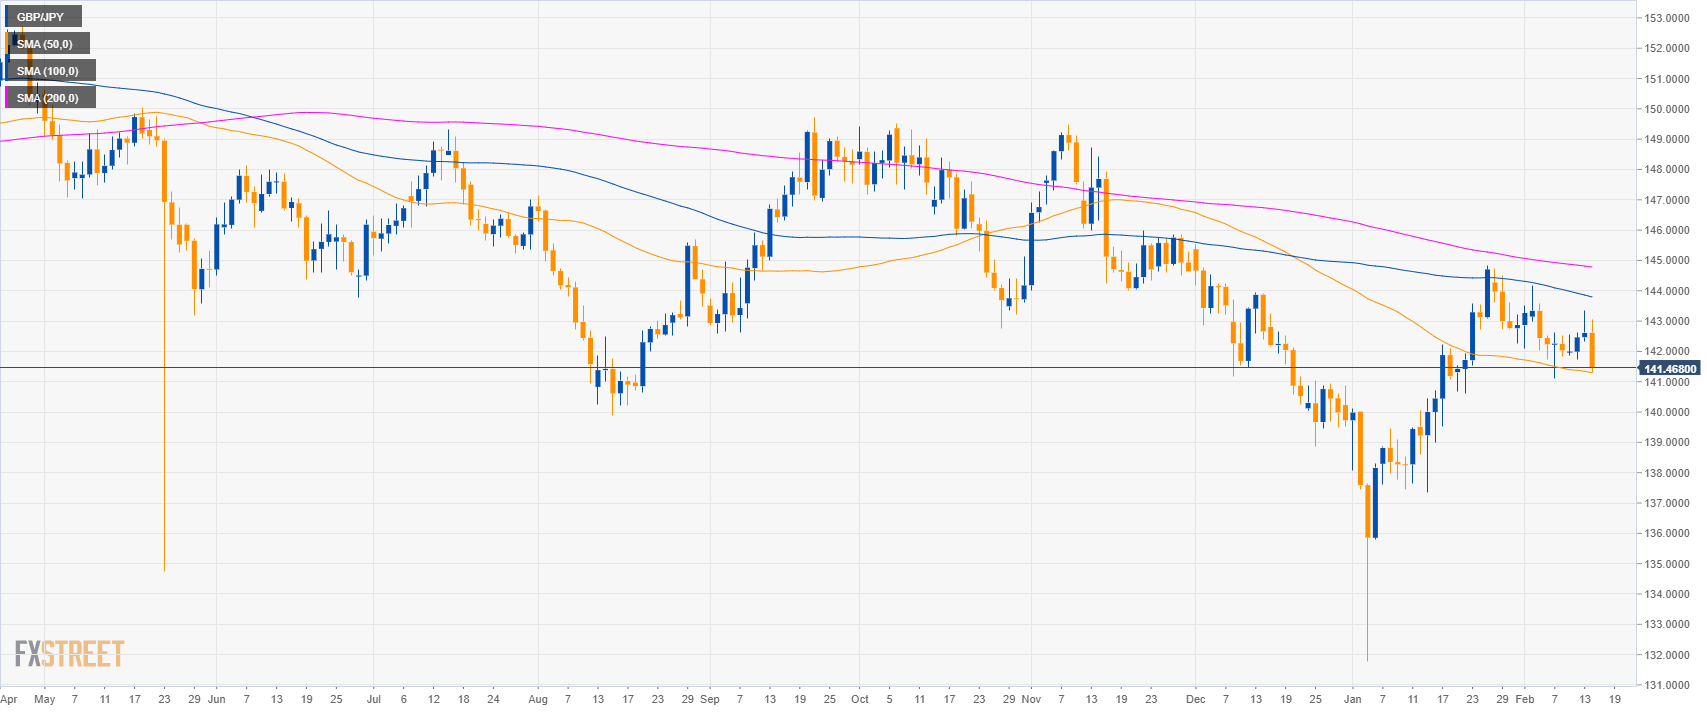
GBP/JPY daily chart
- GBP/JPY is trading in a bear trend below the 100 and 200-day simple moving averages (SMAs).
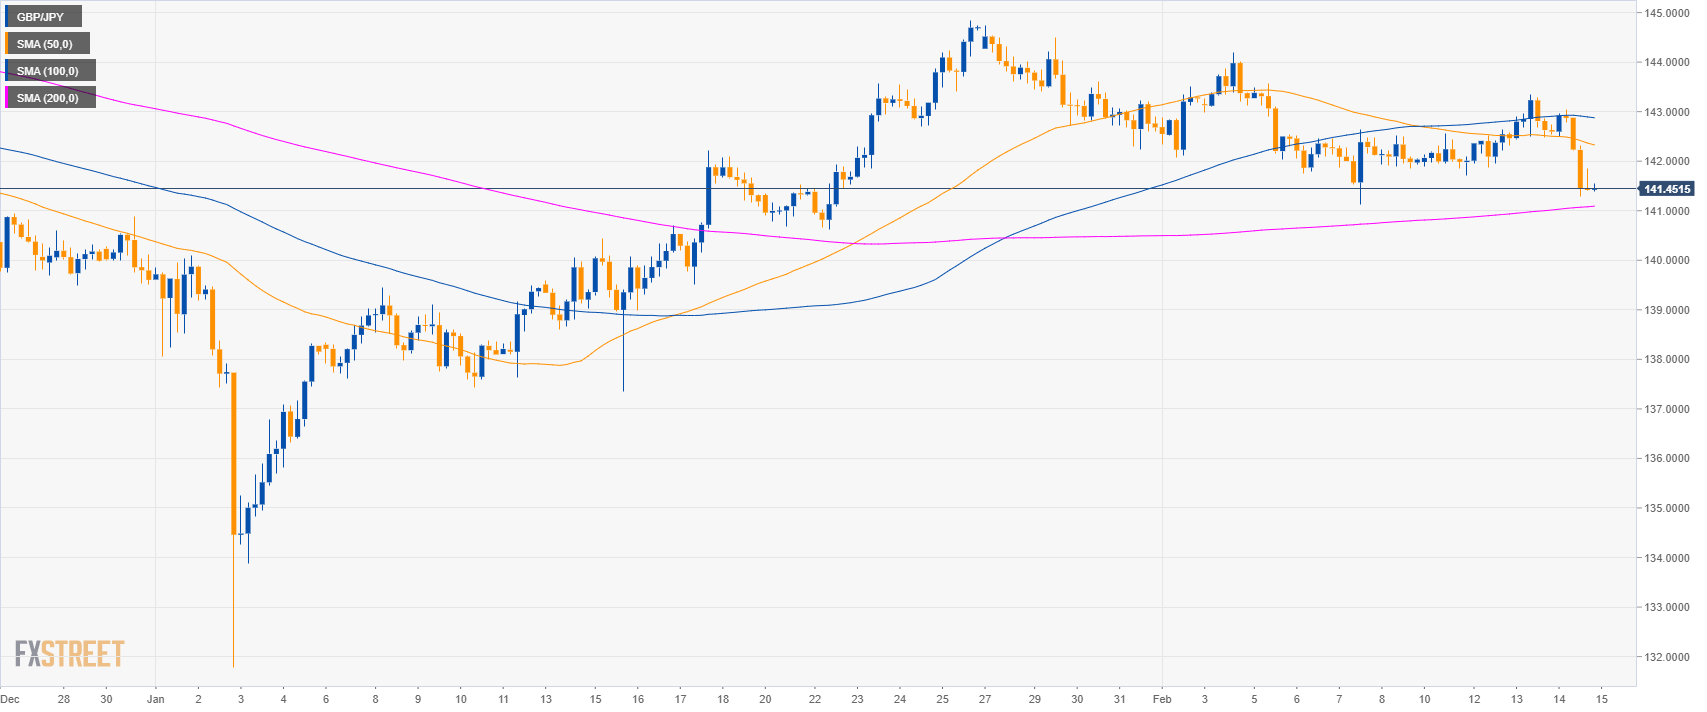
GBP/JPY 4-hour chart
- GBP/JPY is trading between the 100 and 200 SMA on the 4-hour chart suggesting a sideways market in the medium-term.
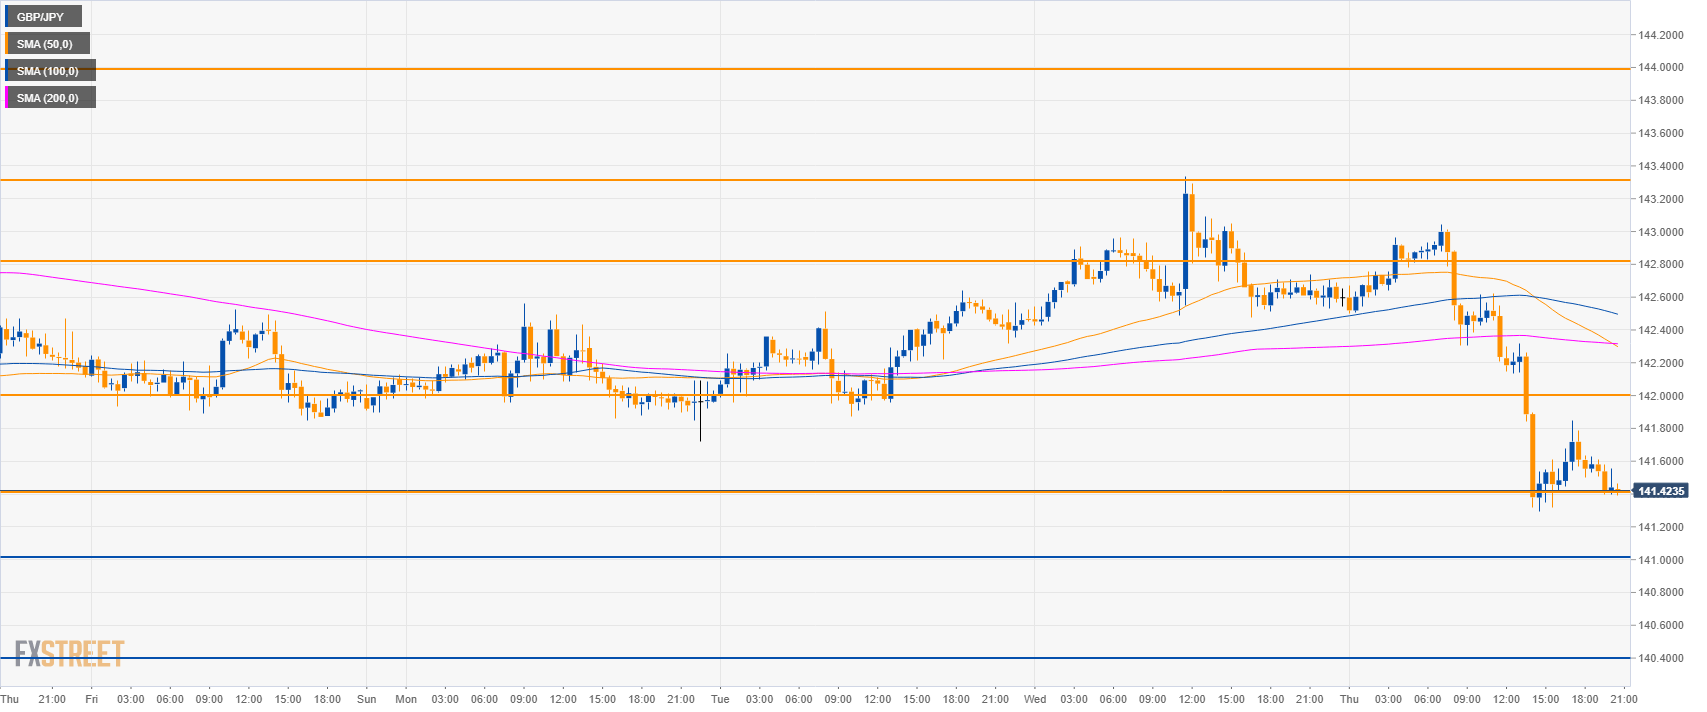
GBP/JPY 30-minute chart
- Bulls broke below the 142.00 figure and the main SMAs suggesting bearish momentum in the near-term.
- GBP/JPY bears need a break below 142.40 to target 141.00 and 140.40 level to the downside.
- On the way up, investors can expect resistance at 142.00 and 142.80 level.
Additional key levels
GBP/JPY
Overview:
Today Last Price: 141.44
Today Daily change: -117 pips
Today Daily change %: -0.82%
Today Daily Open: 142.61
Trends:
Daily SMA20: 142.63
Daily SMA50: 141.35
Daily SMA100: 143.86
Daily SMA200: 144.82
Levels:
Previous Daily High: 143.34
Previous Daily Low: 142.32
Previous Weekly High: 144.18
Previous Weekly Low: 141.12
Previous Monthly High: 144.85
Previous Monthly Low: 131.79
Daily Fibonacci 38.2%: 142.95
Daily Fibonacci 61.8%: 142.71
Daily Pivot Point S1: 142.17
Daily Pivot Point S2: 141.74
Daily Pivot Point S3: 141.16
Daily Pivot Point R1: 143.19
Daily Pivot Point R2: 143.77
Daily Pivot Point R3: 144.21
