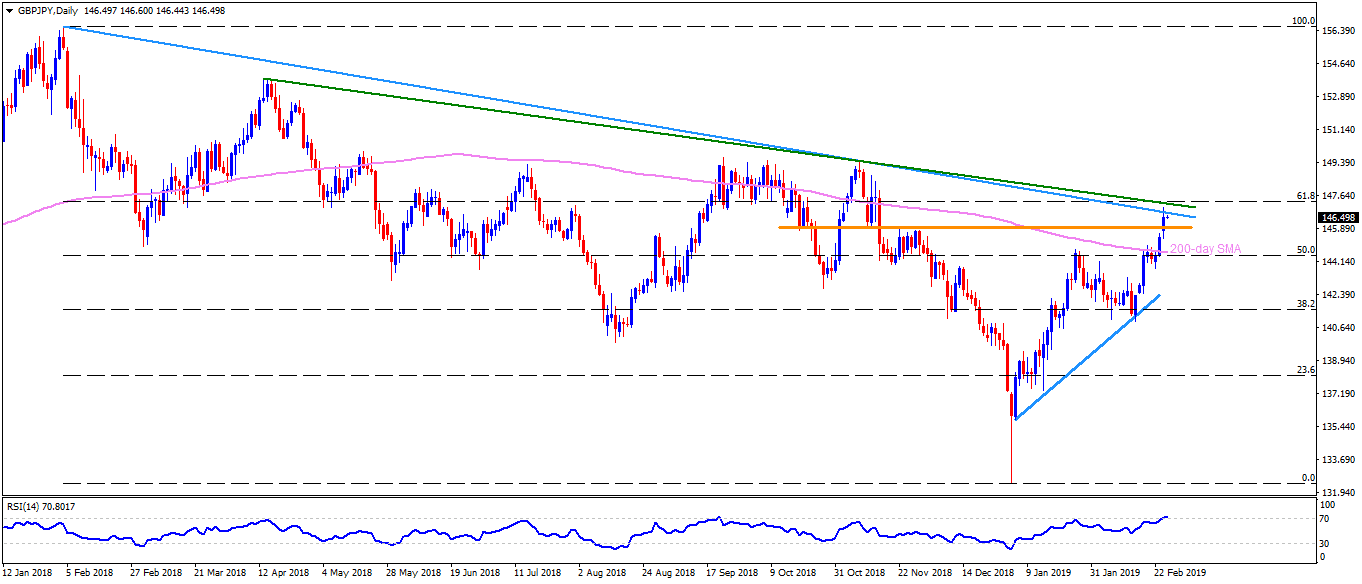
- GBP/JPY trades around 146.55 during initial Asian sessions on Wednesday.
- Yesterday, the pair crossed a yearlong resistance-line joining February 2018 high to November but failed to close beyond the same upside barrier.
- The pair has been trading well beneath the 146.85 resistance-line since morning, which in turn highlights the importance of 146.00 – 145.90 horizontal support area for the sellers.
- Should the pair slips under 145.90, Tuesday’s low around 145.35 may offer intermediate halt ahead of dragging it to the 200-day simple moving average (SMA) level of 144.65.
- Meanwhile, an upside clearance of 146.85 trend-line can’t be considered as a strong signal for the pair’s rise as another resistance-line connecting high of April and November 2018, together with 61.8% Fibonacci Retracement of February 2018 to January 2019 downturn, at 147.35 can challenge buyers.
- Given the bulls ability to cross 147.35, 148.45, 149.30 and 150.00 can come forward as favorites.
GBP/JPY daily chart
Additional important levels:
Overview:
Today Last Price: 146.53
Today Daily change: -3 pips
Today Daily change %: -0.02%
Today Daily Open: 146.56
Trends:
Daily SMA20: 143.25
Daily SMA50: 141.56
Daily SMA100: 143.48
Daily SMA200: 144.61
Levels:
Previous Daily High: 147.06
Previous Daily Low: 145.4
Previous Weekly High: 145.05
Previous Weekly Low: 142.46
Previous Monthly High: 144.85
Previous Monthly Low: 131.79
Daily Fibonacci 38.2%: 146.43
Daily Fibonacci 61.8%: 146.03
Daily Pivot Point S1: 145.61
Daily Pivot Point S2: 144.67
Daily Pivot Point S3: 143.95
Daily Pivot Point R1: 147.28
Daily Pivot Point R2: 148.01
Daily Pivot Point R3: 148.95
