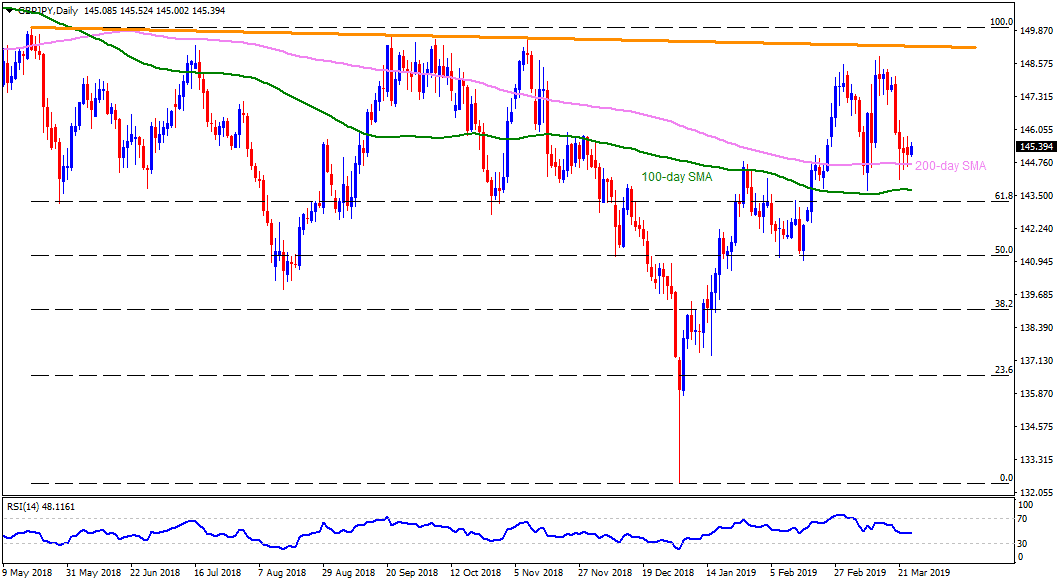
GBP/JPY daily chart
- GBP/JPY trades near 145.40 during early Tuesday.
- The pair continues to be supported by the 200-day simple moving average (SMA) on daily chart around 144.70 with 100-day SMA level of 143.75 offering follow-on support to watch.
- On the upside, a bit broader descending trend-line stretched since May 2018, at 149.30, becomes crucial for Bulls as it holds the gate for the quote’s rally to 150.00.
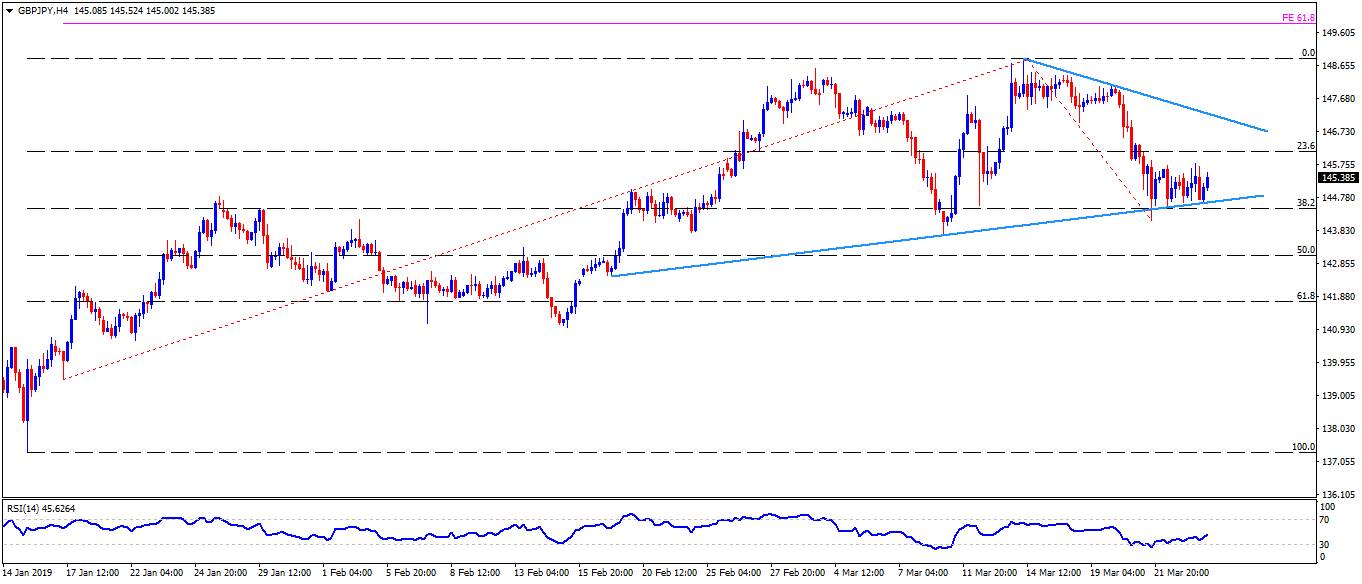
GBP/JPY 4-Hour chart
- An upward sloping trend-line joining lows since February 19 and a descending resistance-line from March 14 together portray a short-term symmetrical triangle formation on the 4-hour chart between 144.60 and 147.30 area.
- However, 145.90 and 146.60 could act as buffer stops.
- Should the quote cross 147.30 resistance, it can rally to it mid-month high around 148.90 while 61.8% Fibonacci expansion (FE) of 149.90 can act as buffers prior to highlighting 150.00 mark.
- On the downside break of 144.60, 143.80 and 50% Fibonacci retracement near 143.10 could entertain sellers with 61.8% Fibonacci level of 141.80 and 141.00 likely to be on their list afterward.
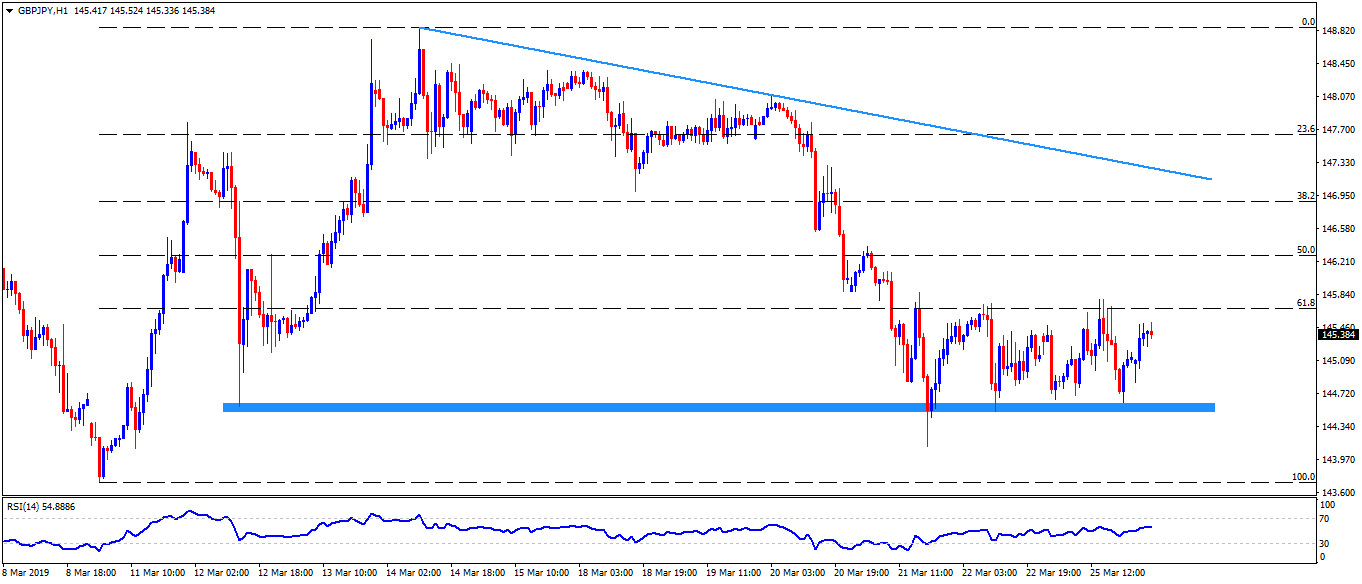
GBP/JPY hourly chart
- The 144.60-50 area acts as immediate support contrast to 145.90 being nearby resistance.
- Also, 146.10 can offer an intermediate halt between 145.90 and 146.60.