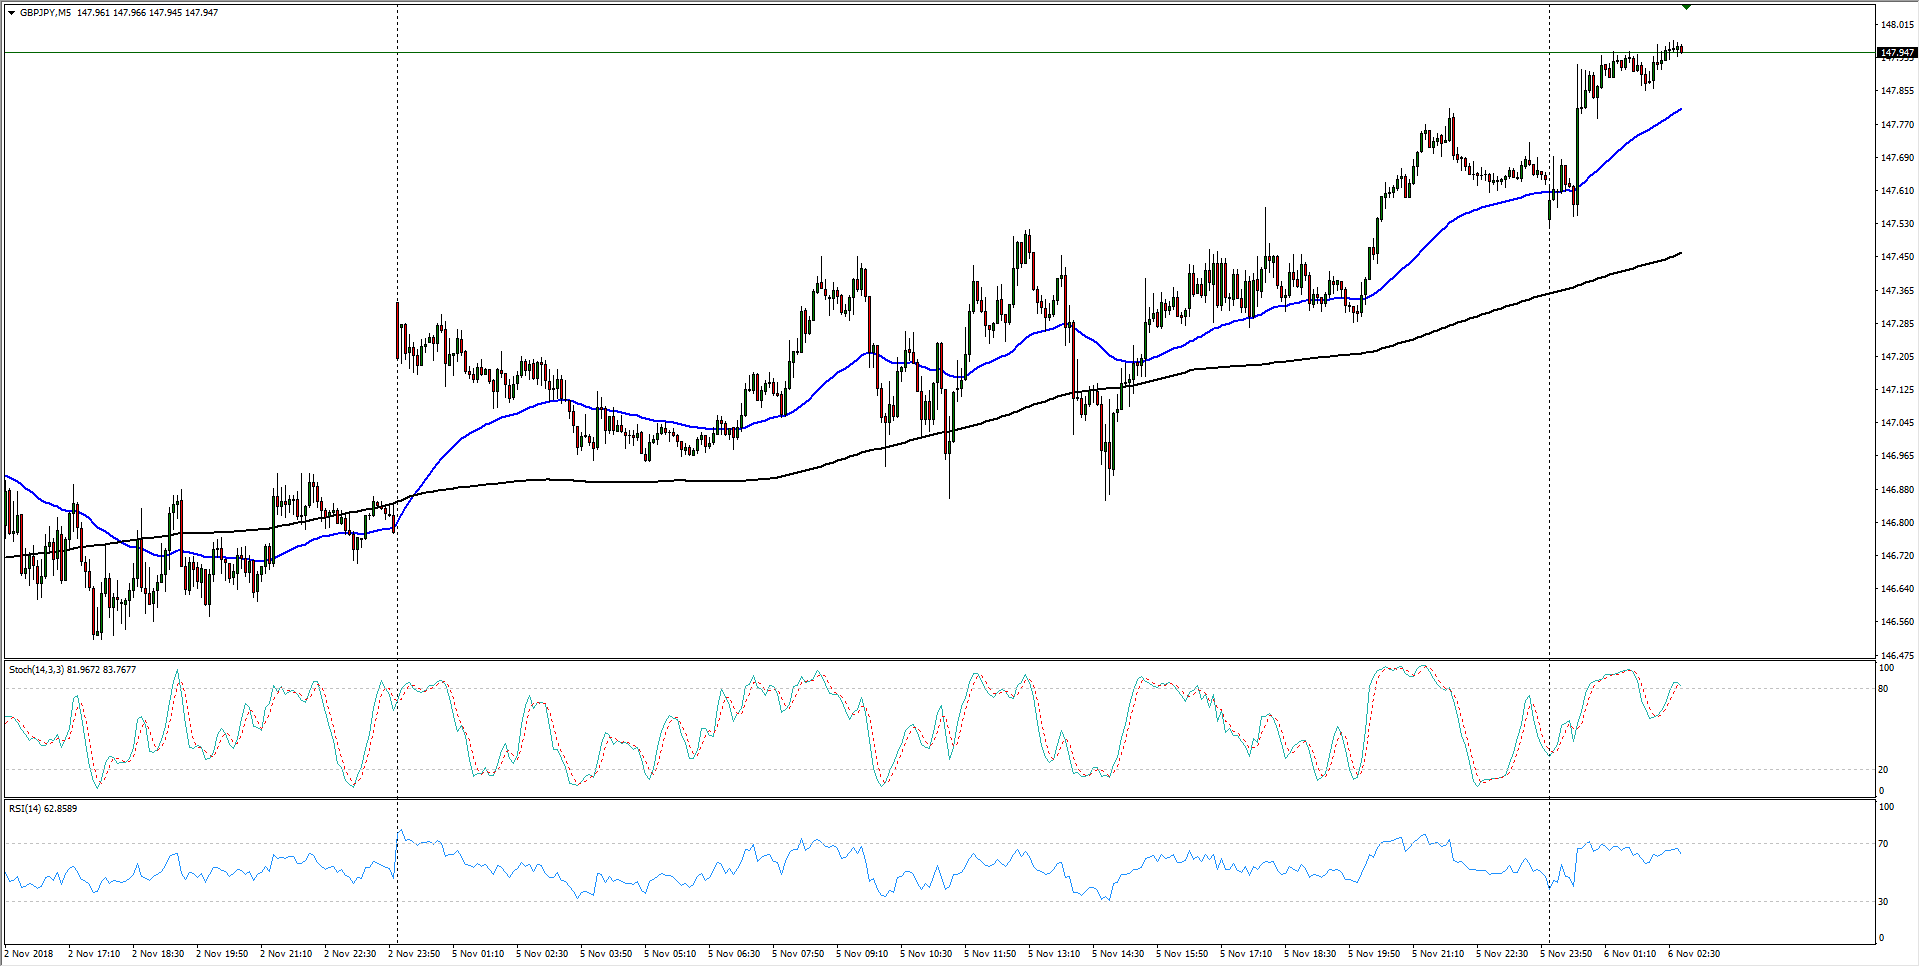
- The GBP/JPY is teasing a break into the 148.00 technical level in early Tuesday’s action, lifting from the day’s opening bids near 147.60 as the pair continues to find support from the 50-period moving average, currently resting near 147.80.
GBP/JPY M5
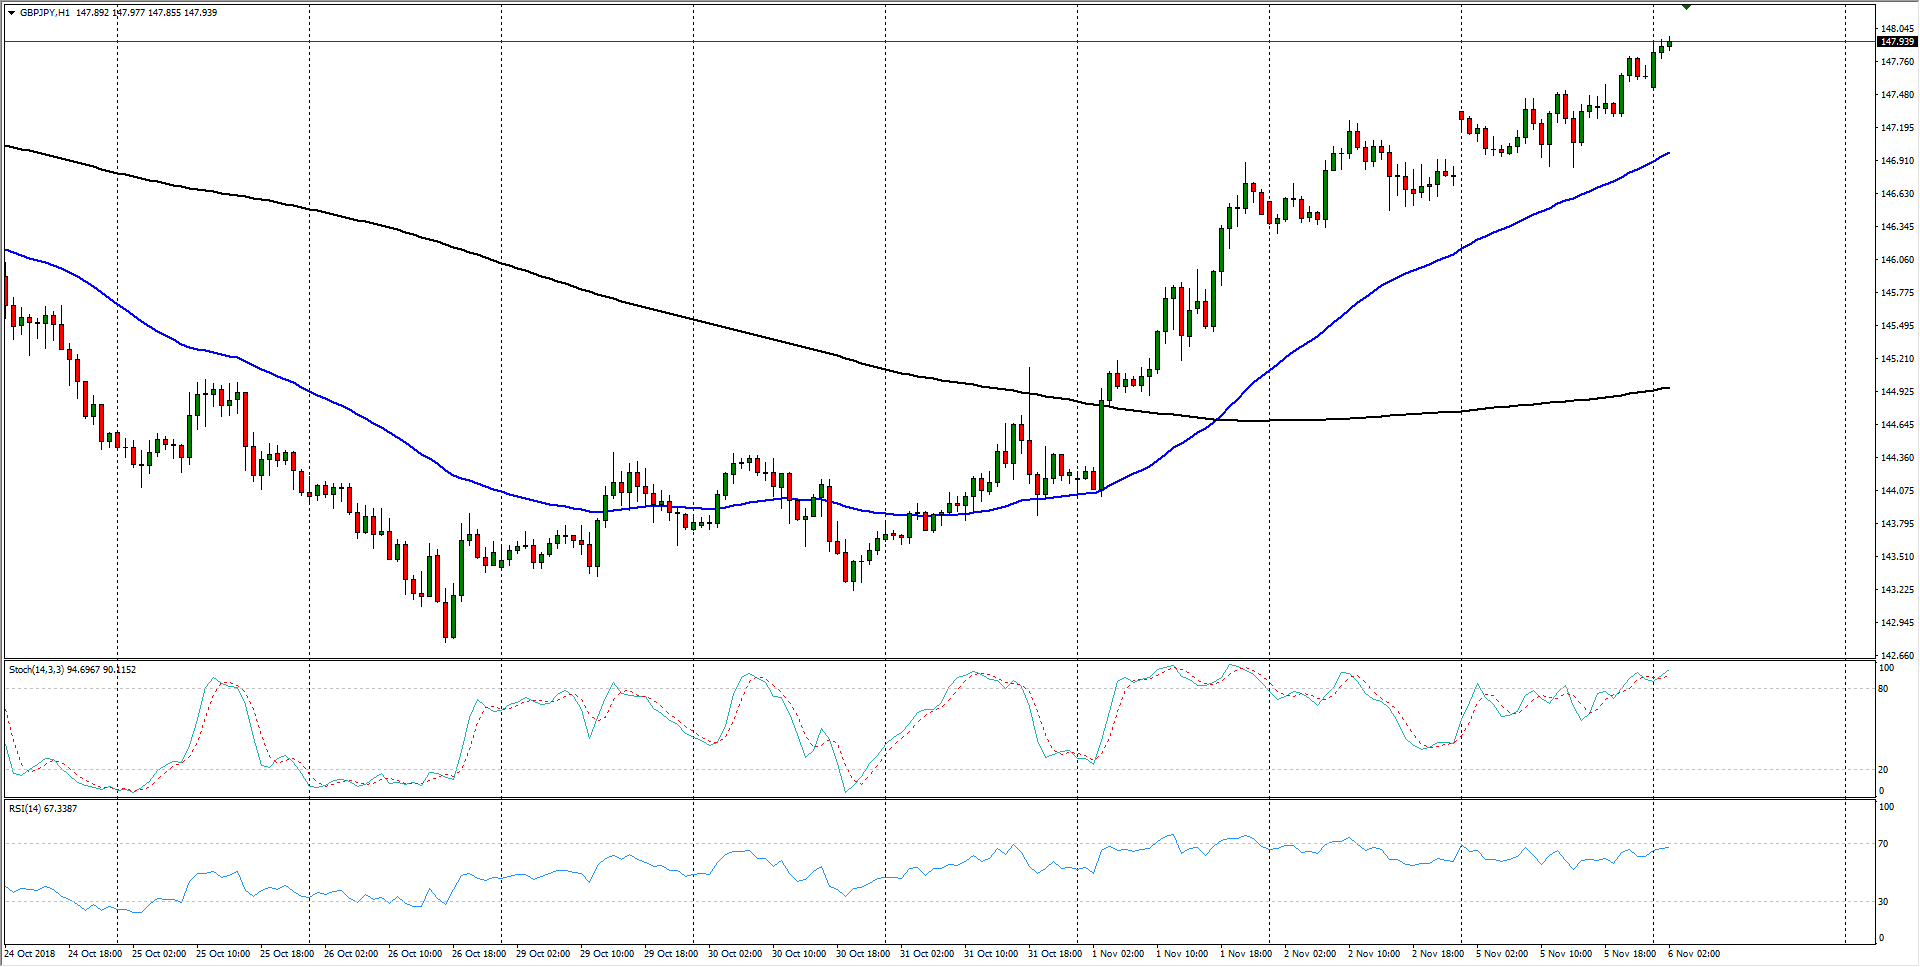
- Hourly candles have the Guppy overextended with 1-Hour indicators pinned near overbought conditions, but the pair is showing little signs of slowing as the GBP/JPY heads further north from the 200-hour moving average at 145.00.
GBP/JPY H1
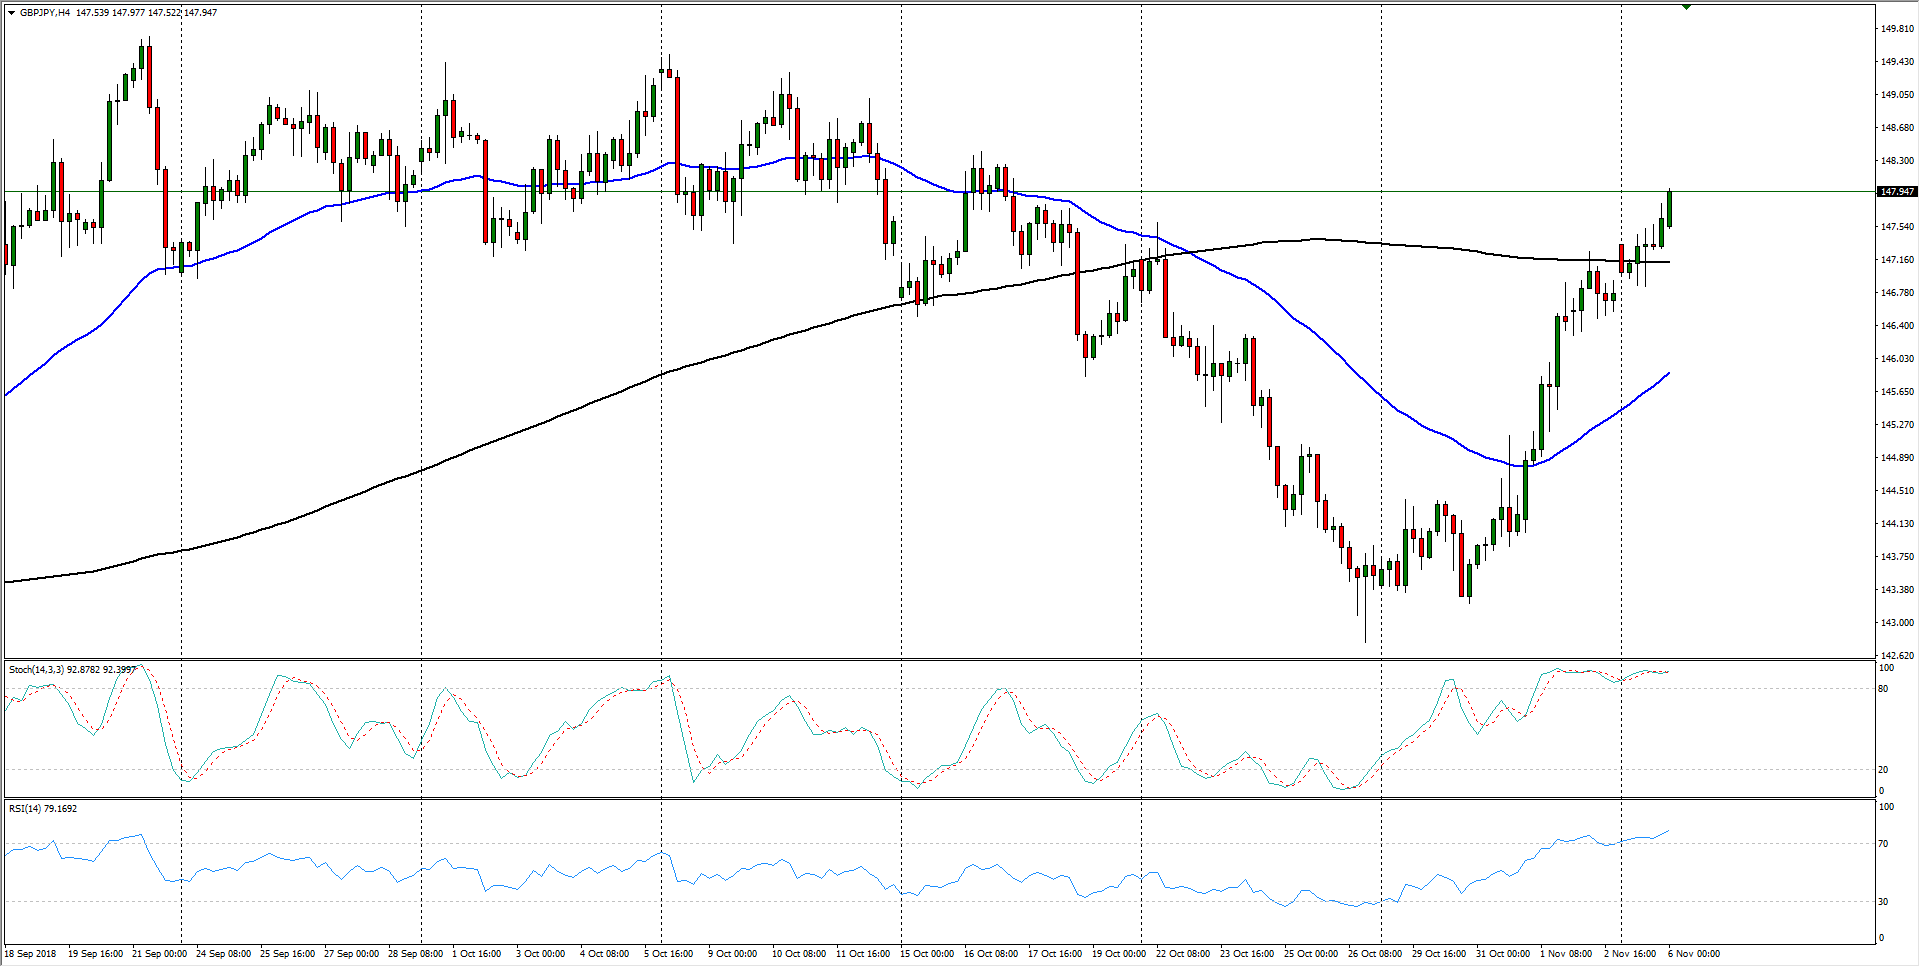
- The past eight weeks shows the GBP/JPY grinding steadily higher to return to September’s previous consolidation zone, and continued buying will see resistance from familiar levels near the upper bound at the 149.00 handle.
GBP/JPY H4
GBP/JPY
Overview:
Last Price: 147.96
Daily change: 32 pips
Daily change: 0.217%
Daily Open: 147.64
Trends:
Daily SMA20: 146.3
Daily SMA50: 146.38
Daily SMA100: 145.69
Daily SMA200: 147.51
Levels:
Daily High: 147.82
Daily Low: 146.86
Weekly High: 147.26
Weekly Low: 143.22
Monthly High: 149.52
Monthly Low: 142.78
Daily Fibonacci 38.2%: 147.45
Daily Fibonacci 61.8%: 147.22
Daily Pivot Point S1: 147.06
Daily Pivot Point S2: 146.48
Daily Pivot Point S3: 146.1
Daily Pivot Point R1: 148.01
Daily Pivot Point R2: 148.39
Daily Pivot Point R3: 148.97
