GBP/USD has been on the rise as the chances for a no-deal Brexit are falling after a bill to block a hard exit advanced in parliament. What are the next targets?
The Technical Confluences Indicator is showing that GBP/USD is battling a cluster of lines around 1.2242. This includes the previous 1h-low, the Simple Moving average 10-1h, the Fibonacci 23.6% one-month, the SMA 10-15m, the Bollinger Band 15min-Middle, and the Fibonacci 61.8% one-week.
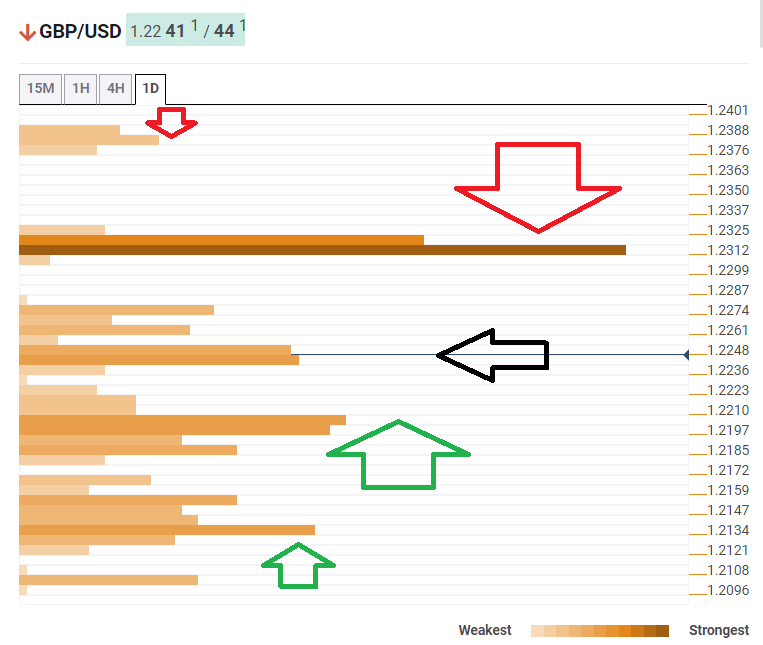
Sterling now eyes 1.2312 as the next target. It is the convergence of the BB 1d-Upper, the previous monthly high, the previous weekly high, the Pivot Point one-month Resistance 1, and the SMA 50-1d.
Further above, 1.2382 is the next cap where the PP 1d-R2 and the PP 1w-R2 meet.
Looking down, support awaits at 1.2204, which is the confluence of the Fibonacci 38.2% one-month, the SMA 100-15m, and the SMA 10-1d.
Lower, the next cushion is 1.2134, which is where the Fibonacci 61.8% one-month, the SMA 100-1h, and the PP 1d-S1 converge.
This is how it looks on the tool:
Confluence Detector
The Confluence Detector finds exciting opportunities using Technical Confluences. The TC is a tool to locate and point out those price levels where there is a congestion of indicators, moving averages, Fibonacci levels, Pivot Points, etc. Knowing where these congestion points are located is very useful for the trader, and can be used as a basis for different strategies.
This tool assigns a certain amount of “weight” to each indicator, and this “weight” can influence adjacents price levels. This means that one price level without any indicator or moving average but under the influence of two “strongly weighted” levels accumulate more resistance than their neighbors. In these cases, the tool signals resistance in apparently empty areas.
Learn more about Technical Confluence
