Top to bottom:
We start with resistance at 1.3837.
1.3770 has held in resistance since May 2018.
GBP/USD posted considerable gains last week. The upcoming week has three releases, highlighted by key employment reports. Here is an outlook for the highlights and an updated technical analysis for GBP/USD.
In the UK, inflation improved to 0.6% in December, up from 0.3%. CBI Industrial Order Expectations and GfK Consumer Confidence remained deep in negative territory, with readings of -38 and -28, respectively. Retail Sales rebounded from a previous decline but just barely, with a reading of 0.3%. This was well shy of the estimate of 1.4%. The December PMIs highlighted a tale of two sectors, as manufacturing came in at 52.9, indicating expansion. Services, however, continues to contract, and slowed to 38.8 points.
.
GBP/USD daily graph with resistance and support lines on it. Click to enlarge:
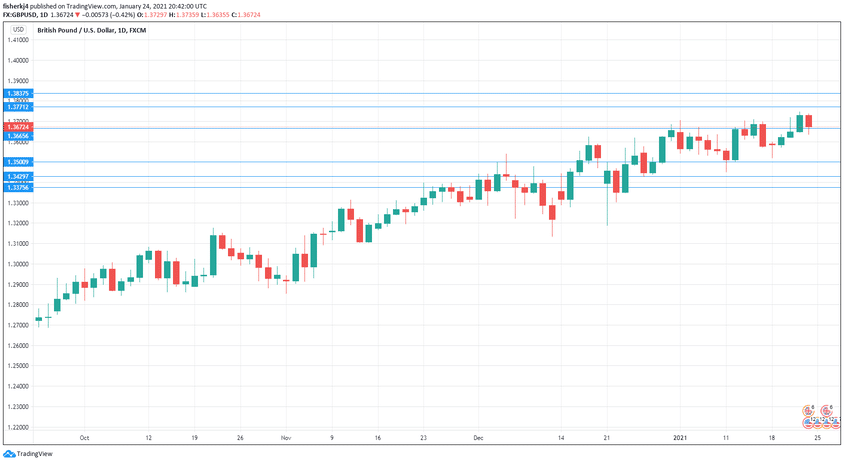
Top to bottom:
We start with resistance at 1.3837.
1.3770 has held in resistance since May 2018.
1.3666 is an immediate support line.
1.3502 (mentioned last week) is protecting the symbolic 1.35 line.
1.3428 has held in support since late December.
1.3324 is the final support level for now.
.
I am bullish GBP/USD
After a splash in early January, the US dollar has slowed down against the major currencies, including the pound. With the Biden administration pushing massive stimulus, the dollar could face a bumpy road.
Further reading:
Safe trading!
