Technical lines from top to bottom:
We start with resistance at 1.4016.
1.3812 is next.
GBP/USD enjoyed a solid week, gaining close to 1.0 percent. The upcoming week has five releases, with a focus on PMIs. Here is an outlook for the highlights and an updated technical analysis for GBP/USD.
The pound is enjoying some positive momentum from the Brexit deal, as the currency has climbed to its highest level since May 2018. It was a quiet Christmas week, with only one British release on the calendar. Nationwide HPI edged down from 0.9% to 0.8%.
In the US, the Chicago PMI rose to 59.5 in December, up from 58.2 and beating the forecast of 56.6 points. Pending Home Sales declined for a third straight month, with a reading of -2.6%. The week ended on a positive note, as unemployment claims dropped for a second straight week, falling to 787 thousand.
.
GBP/USD daily graph with resistance and support lines on it. Click to enlarge: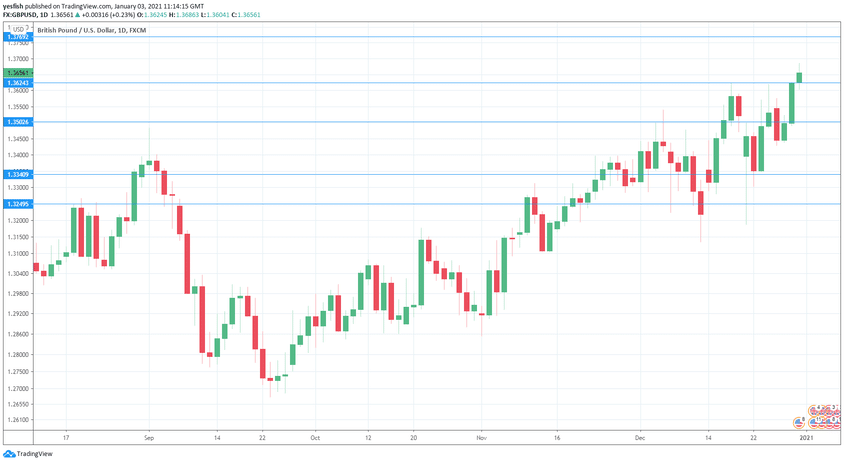
GBP/USD Technical Analysis
Technical lines from top to bottom:
We start with resistance at 1.4016.
1.3812 is next.
1.3769 has held in resistance since May 2018.
1.3624 is the first line of support.
1.3502 (mentioned last week) was tested in support last week.
1.3340 is next.
1.3249 is the final support level for now.
.
I am bullish on GBP/USD
The pound has had only one losing week since October, as sentiment towards the US dollar remains low. In addition, the signing of the Brexit agreement has brought a sense of relief to the markets and is a bullish event for the pound.
Further reading:
Safe trading!
