- GBP/USD lost about 10% in seven days.
- The level to beat for bears is the 1.1797 support.
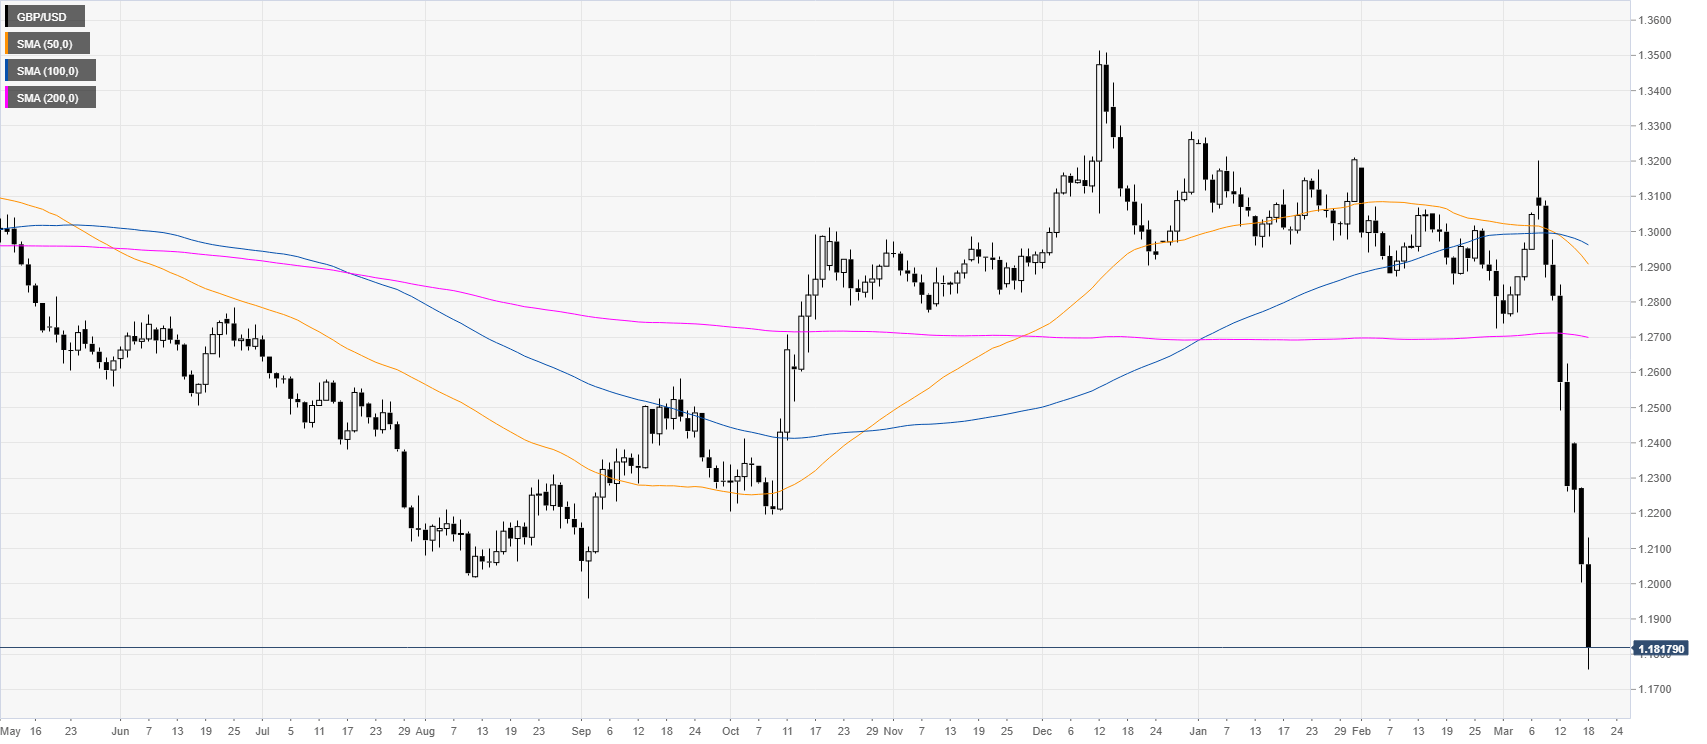
GBP/USD daily chart
GBP/USD is melting down in the last seven days as the market is trading to its lowest since 1985. USD strength is taking its toll on GBP/USD.
GBP/USD four-hour chart
GBP/USD is under heavy selling pressure in 1985 lows trading well below its main SMAs. The sellers are in control and a break below the 1.1797 support can lead to further losses towards 1.11760 and 1.1680 levels, according to the Technical Confluences Indicator. Resistance is seen near the 1.1880, 1.1960 and 1.2100 levels.
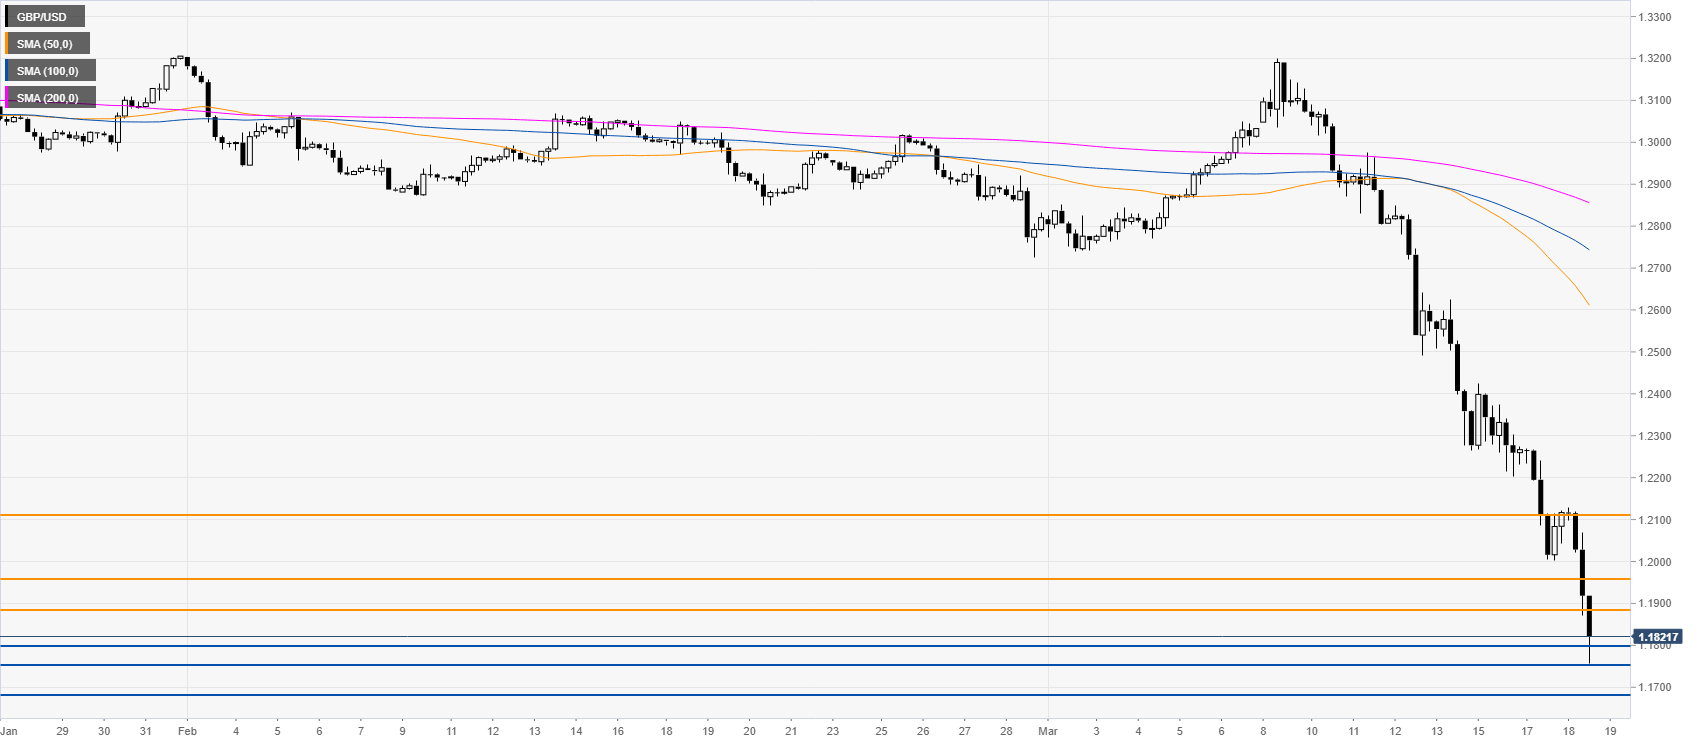
Resistance: 1.1880, 1.1960, 1.2100
Support: 1.1797, 1.1760, 1.1680
Additional key levels
