GBP/USD has been on the rise after opposition parties agreed on a path forward in the attempt to block a no-deal Brexit. With 64 days to go, uncertainty remains high.
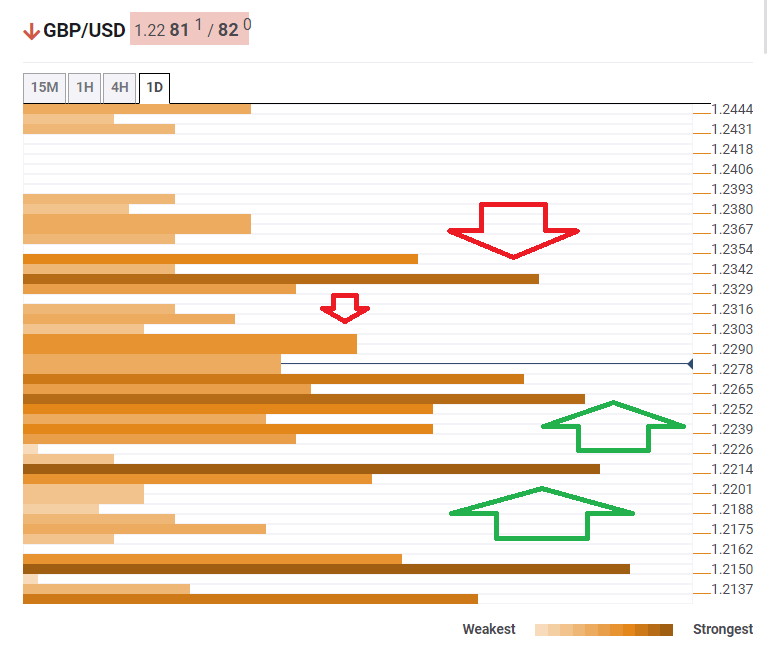
The Technical Confluences Indicator is showing that GBP/USD enjoys significant support around 1.2258, where a cluster of levels awaits it. This includes the Simple Moving Average 200-15m, the Fibonacci 23.6% one-month, the SMA 10-4h, the SMA 200-4h, the Fibonacci 38.2% one-day, the Bollinger Band 15min-Lower, and more.
Further down, even stronger support awaits at 1.2214, which is the convergence of the previous daily low and the all-important Fibonacci 38.2% one-week.
Looking up, only weak resistance is seen at 1.2290, where the Fibonacci 23.6% one-day, the previous 4h-high, and the previous daily high converge.
More substantial resistance awaits only at 1.2329, which is the confluence of the Pivot Point one-day Resistance 1 and the Fibonacci 38.2% one-month.
This is how it looks on the tool:
Confluence Detector
The Confluence Detector finds exciting opportunities using Technical Confluences. The TC is a tool to locate and point out those price levels where there is a congestion of indicators, moving averages, Fibonacci levels, Pivot Points, etc. Knowing where these congestion points are located is very useful for the trader, and can be used as a basis for different strategies.
This tool assigns a certain amount of “weight” to each indicator, and this “weight” can influence adjacents price levels. This means that one price level without any indicator or moving average but under the influence of two “strongly weighted” levels accumulate more resistance than their neighbors. In these cases, the tool signals resistance in apparently empty areas.
Learn more about Technical Confluence
