- GBP/USD retraces from a short-term SMA after positing the heaviest losses in two weeks.
- Bearish MACD favors further selling to the support line stretched from July 20.
- A three-month-old resistance line will question the bulls during a fresh upside.
Despite bouncing off a one-week low the previous day, GBP/USD looks for a clear direction while taking rounds to 1.3275 during Friday’s Asian session. The cable slumped to the 10-day SMA after marking the biggest losses since August 21 on Thursday. However, any further declines have been probed by the traders’ pre-NFP cautious mood.
Even so, bearish MACD signals suggest the pair’s further weakness, which in turn highlights a multi-day-old support line, at 1.3220 for sellers.
Also acting as downside filters could be August 06 high of 1.3185 and the July month’s top surrounding 1.3170.
In a case where the US dollar snaps the three-day winning streak after August month’s employment numbers, buyers may aim for 1.3350 and 1.3400 immediate resistances.
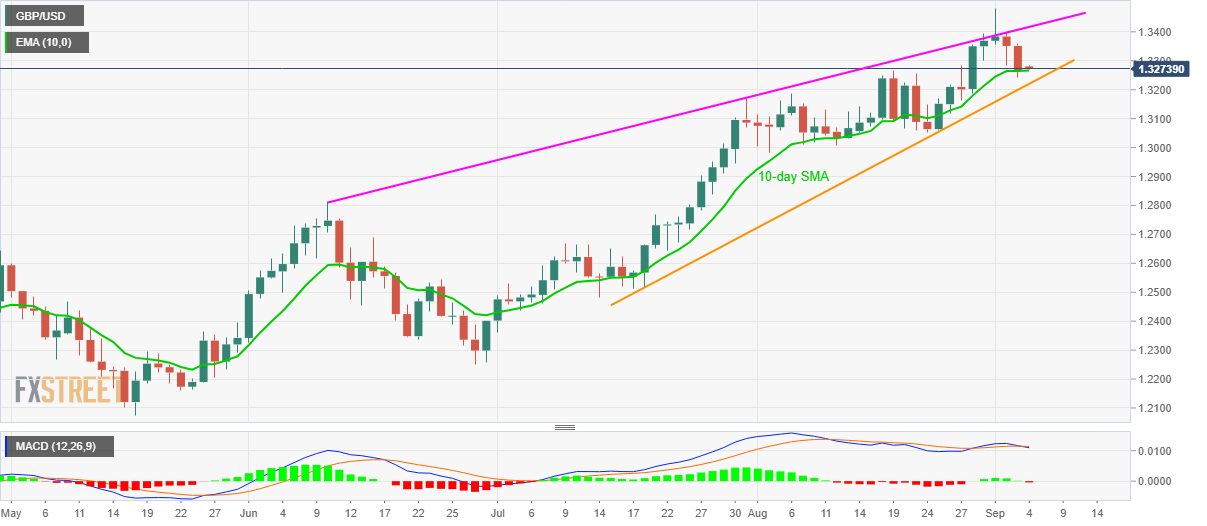
Though, any further upside past-1.3400 will be probed by an ascending trend line from June 10, close to 1.3415/20.
GBP/USD daily chart
Trend: Further weakness expected
