- GBP/USD registers another failure to cross 100-day SMA.
- A short-term falling trend line adds to the resistance.
- Bearish MACD signals keep sellers hopeful amid a lower high formation since the month’s start.
GBP/JPY stays mildly weak to 1.2950 during the Asian session on Monday. In doing so, the pair fails to extend Friday’s bounce while staying below 100-day SMA.
Not only multiple failures to cross 100-day SMA but a short-term descending resistance line portraying the lower high pattern since the month’s start, as well as bearish MACD, also favor the sellers.
That said, the NZD/USD prices may now revisit 50% Fibonacci retracement of October-December 2019 upside, at 1.2854, a break of which could further push the bears towards November 2019 low of 1.2768.
On the upside, a downward sloping trend line since February 03, at 1.2995 will challenge buyers beyond a 100-day SMA level of 1.2960.
If at all the quote manages to rise past-1.2995, also clears 1.3000 round-figure, it can then aim for February 13 top surrounding 1.3070.
GBP/USD daily chart
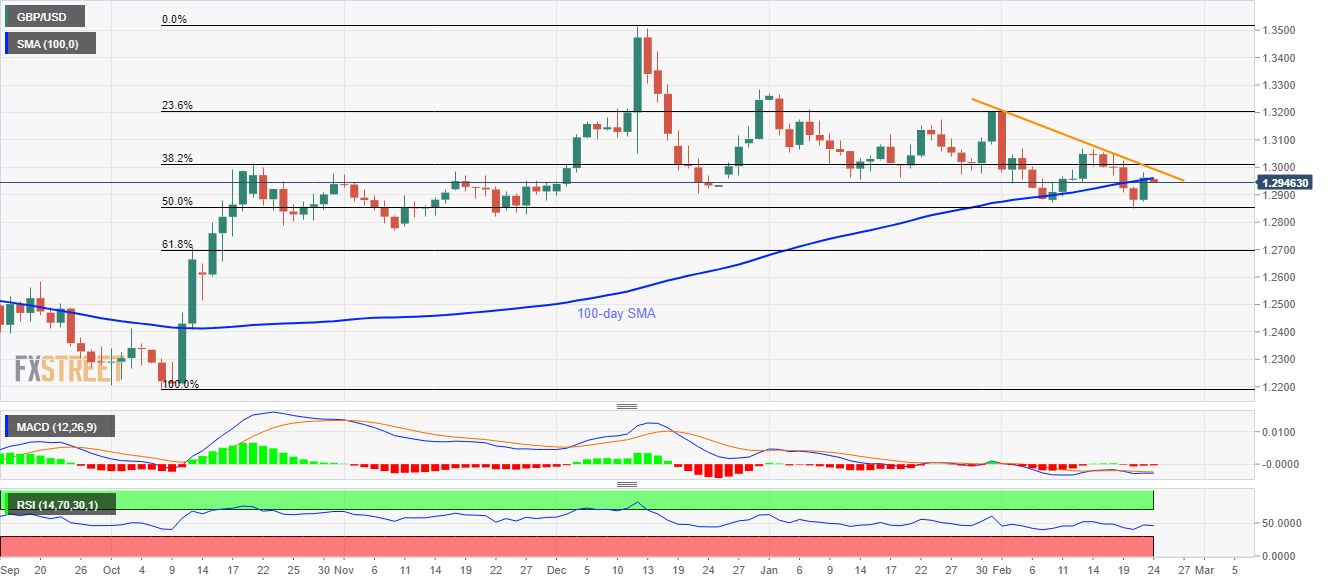
Trend: Bearish
