- GBP/USD consolidates from four-day top but keeps the bullish signals around 1.2520.
- 38.2% Fibonacci retracement joins short-term SMA to strengthen the immediate resistance.
- MACD stays bearish and suggests a pullback, sellers await a break below 1.2500 for entries.
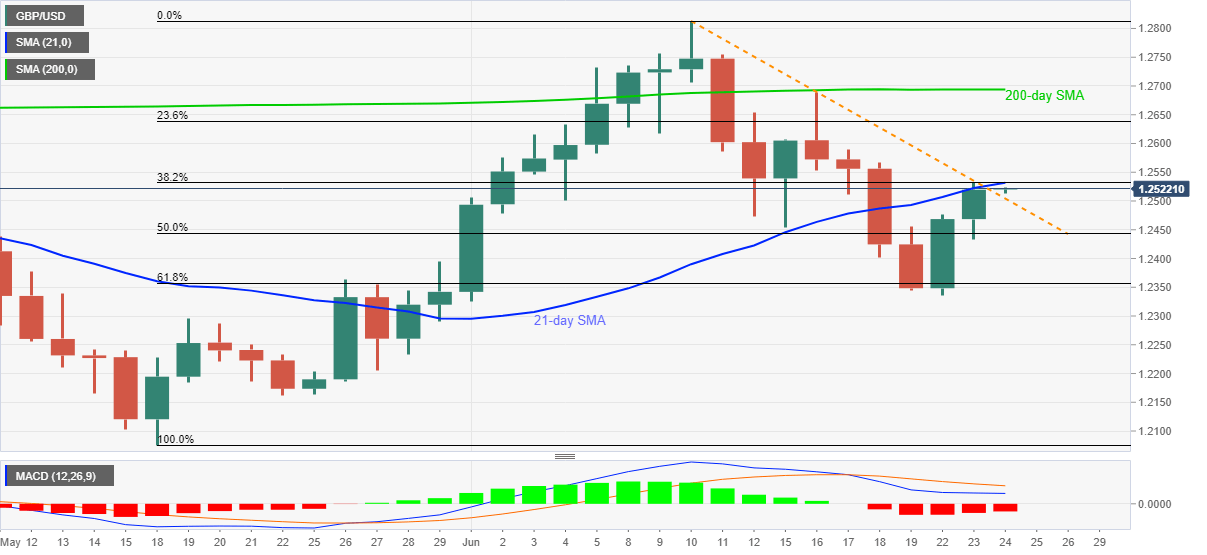
GBP/USD retraces from the weekly top while declining to 1.2515 during the initial Asian session on Wednesday. The Cable seems to find it difficult to extend the break of a downward sloping trend line from June 10. The reason could be cited by a confluence of 21-day SMA and 38.2% Fibonacci retracement level of May-June upside.
In addition to the strong resistance around 1.2530/35, bearish conditions of MACD histogram also pushes the traders to doubt the further upside. Even so, the bears are less likely to enter unless the quote slips below the resistance-turned-support line, currently around 1.2500.
If at all buyers refrain to respect the downbeat signals and clear 1.2535 upside barrier, 1.2600 and 23.6% Fibonacci retracement around 1.2640 will be on their radars. However, a 200-day SMA level of 1.2695 might question the further upside.
On the contrary, the pair’s declines below 1.2500 can recall sellers trying to break 61.8% Fibonacci retracement level around 1.2355 and the monthly bottom close to 1.2335. It’s worth mentioning that the quote’s additional weakness past-1.2335 will divert the sellers to May 19 top near 1.2300.
GBP/USD daily chart
Trend: Pullback expected
