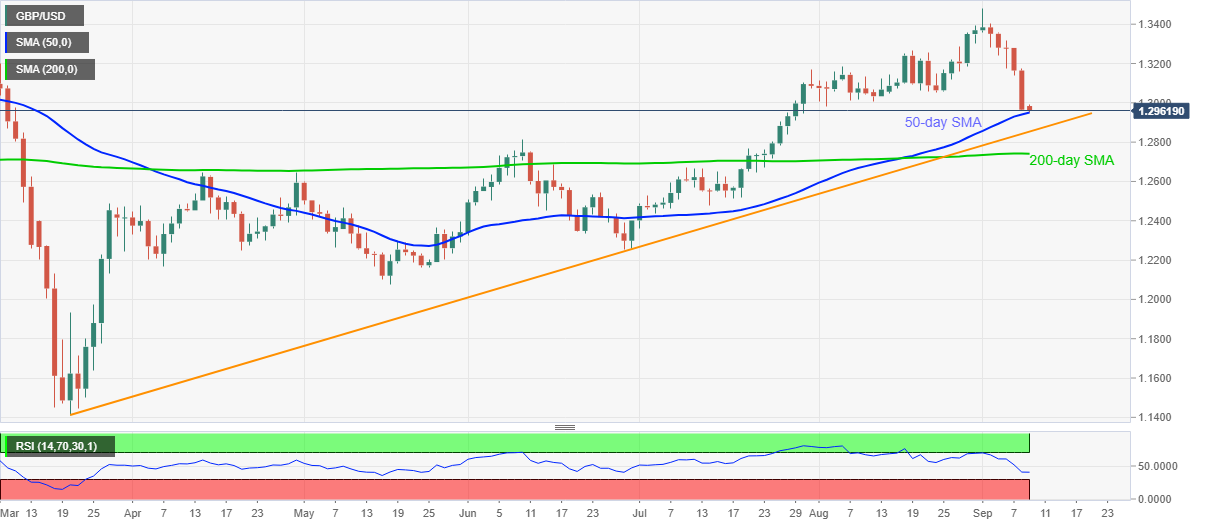
- GBP/USD bears catch a breather at six-week low, dropped nearly 200-pips on Tuesday.
- An ascending trend line from March 20, June month’s high add to the support.
- Bulls need a clear break of late-August low to attempt recovery moves.
GBP/USD retraces from the multi-day low of 1.2950 to 1.2962 during the pre-Tokyo open trading on Wednesday. The Cable marked heaviest losses since March 18 the previous day as Brexit pessimism took over. However, failures to break 50-day SMA, needless to mention about an ascending trend line from late-March and June month’s top, suggest further consolidation of the quote.
Though, the 1.3000 threshold and August 24 low near 1.3050/55 guard the pair’s immediate upside ahead of March month’s peak of 1.3200.
Additionally, the pair’s sustained run-up past-1.3200 will confront the 1.3265/70 resistance area ahead of challenging the monthly high surrounding 1.3480.
On the contrary, a downside break of 50-day SMA, at 1.2950 now, will have a bumpy road ahead as a multi-day-old support line and June month’s peak can question the bears around 1.2850 and 1.2810 respectively.
Even if the sellers conquer 1.2810, 200-day SMA close to 1.2740 will add filters to the further declines.
GBP/USD daily chart
Trend: Pullback expected

