- GBP/USD eases from 1.2730, stays near the highest since March 12.
- Bullish MACD keeps the bulls hopeful to confront a six-month-old resistance line.
- Sellers may target April tops below 200-day SMA.
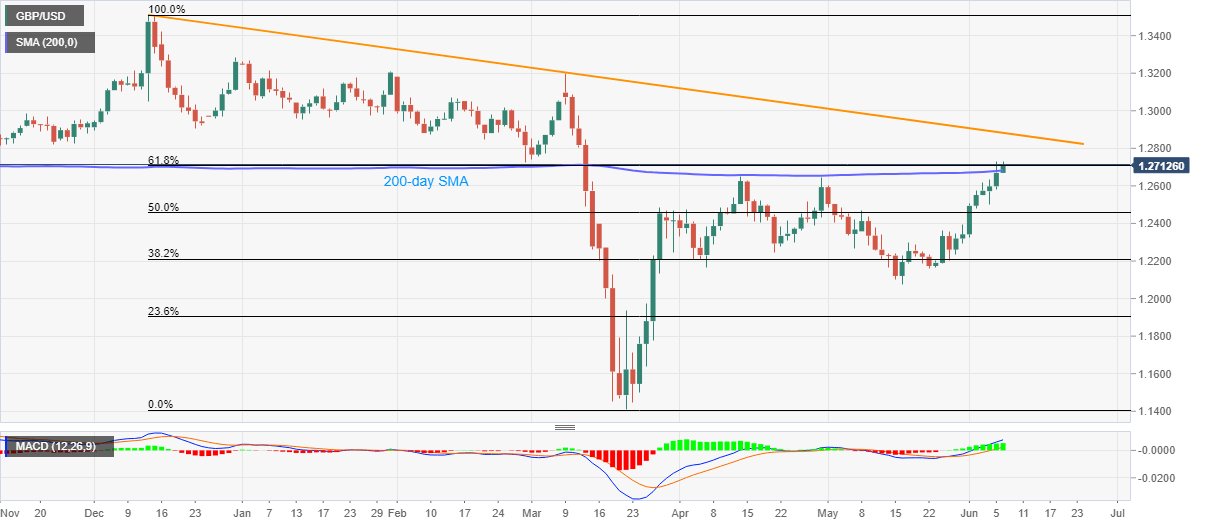
GBP/USD prints 0.30% on a day while trading around 1.2706 amid the early Asian session on Monday. The Cable seesaws near three-month high while staying above 200-day SMA. However, 61.8% Fibonacci retracement of December 2019 to March 2020 fall seems to restrict the pair’s immediate upside.
Even so, bullish MACD favors the buyers to aim for a downward sloping trend line from December 12, 2019, at 1.2885 now, during the further upside.
In doing so, 1.2840/45 might offer an intermediate halt whereas March 2020 top near 1.3200 could lure the bulls beyond the said resistance line.
On the downside, a daily closing below 200-day SMA level of 1.2680 might drag the quote towards the April month top of 1.2648.
Should the quote drop below 1.2648 on a daily basis, 50% Fibonacci retracement level around 1.2460/55 could return to the charts.
GBP/USD daily chart
Trend: Bullish
