- GBP/USD consolidates the biggest losses in a month while trying to regain the 1.2900 round-figure.
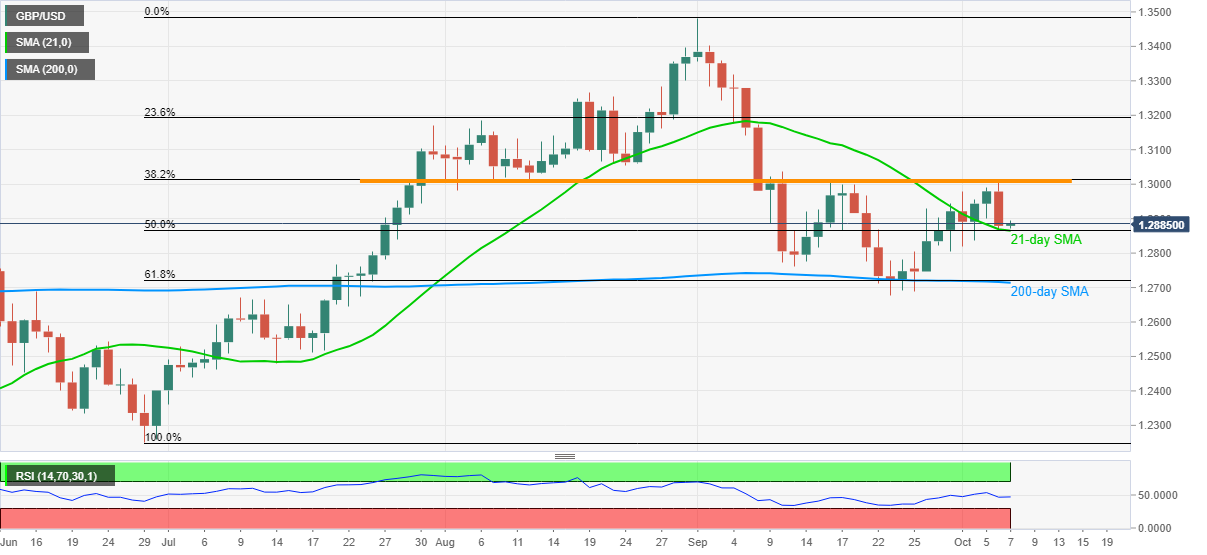
- 21-day SMA, 50% Fibonacci retracement level offers immediate key support.
- A horizontal area since late-July becomes tough resistance to watch.
GBP/USD picks up the bids near 1.2890, up 0.08% intraday during Wednesday’s Asian session. The Cable dropped over 140-pips on Tuesday after failing to overcome the multiple levels surrounding the 38.2% Fibonacci retracement of June-September upside. Though, a joint of 21-day SMA and 50% Fibonacci retracement seems to trigger the latest pullback.
With the normal RSI conditions favoring further recovery in the GBP/USD prices from the key support, bulls may attack 1.2955/60 ahead of confronting the 1.3000 threshold and the crucial horizontal resistance near 1.3015.
If at all the pair manages to cross 1.3015 on a daily closing, the August 24 low near 1.3055 becomes an additional filter to the north.
Alternatively, the pair’s downside past-1.2865 may take a rest near the early September lows surrounding 1.2760 before highlighting the 200-day SMA and 61.8% of Fibonacci retracement close to 1.2720/15.
Additionally, the last month’s bottom, adjacent to 1.2675, becomes the extra support that can challenge the GBP/USD bears.
GBP/USD daily chart
Trend: Further recovery expected
