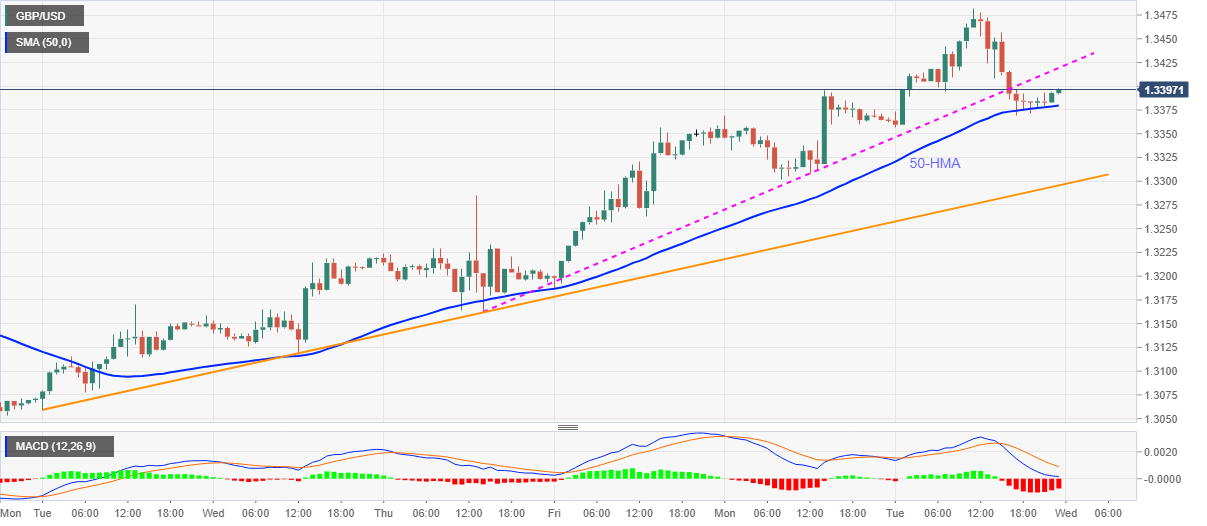
- GBP/USD fades pullback from the yearly high flashed the previous day.
- Short-term key SMA questions the pair’s downside break of one-week-old support line.
- Bearish MACD suggests further weakness, an ascending trend line from August 25 offers additional support.
GBP/USD recovers losses from a multi-week high while picking up the bids near 1.3395 before Wednesday’s Tokyo open. The Cable refreshed the highest since December 2019 the previous day with a run-up to 1.3482 but couldn’t stay positive as the following pullback broke an ascending trend line from August 27 and recalled the 1.3369 level. The downbeat performance takes clues from bearish MACD to keep the sellers hopeful.
However, a clear break below the 50-HMA level of 1.3379 becomes necessary for the pair to visit a bit longer support line, at 1.3295 now.
In a case where the bears dominate past-1.3295, multiple levels marked during the late-August around 1.3230 and 1.3160 can entertain the traders.
On the flip side, a clear break of the adjacent resistance line, previous support, near 1.3420, will be enough for the bulls to challenge the latest high around 1.3485 and aim for the 1.3500 threshold.
Though, the quote’s further upside depends upon how well it crosses December 2019 top surrounding 1.3515.
GBP/USD hourly chart
Trend: Pullback expected

