- GBP/USD remained under some selling pressure for the second straight session on Friday.
- The intraday downtrend managed to find some support near the 1.3900 confluence level.
- Mixed technical indicators warrant some caution before placing aggressive directional bets.
The GBP/USD pair witnessed some heavy selling for the second consecutive session on Friday and dropped to over one-week lows during the early European session.
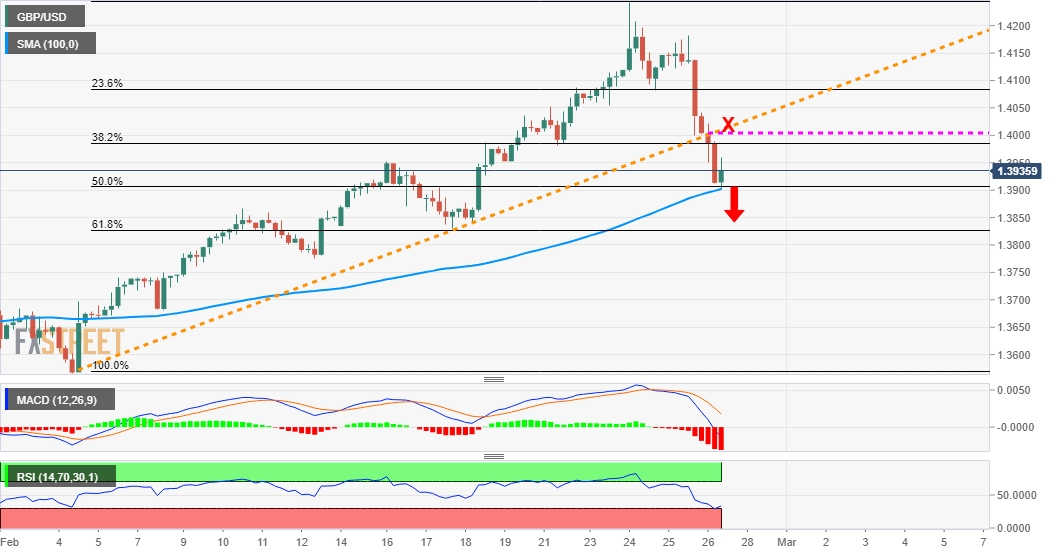
The sharp corrective slide from almost three-year tops stalled near the 1.3900 confluence support amid oversold RSI on intraday charts. The mentioned level comprises the 50% Fibonacci level of the post-BoE strong positive move and 100-period SMA on the 4-hourly chart. This should now act as a key pivotal point for intraday traders.
Meanwhile, oscillators on the daily chart have eased from the overbought zone and are still holding in the bullish territory. This, along with the emergence of some dip-buying, warrants some caution for bearish traders. That said, the GBP/USD pair’s inability to capitalize on the move beyond mid-1.3900s supports prospects for additional losses.
The mixed technical set-up makes it prudent to wait for a sustained break through the 1.3900 mark before traders start positioning for any further depreciating move. A convincing break below would turn the GBP/USD pair vulnerable to accelerate the fall towards mid-1.3800s en-route the 61.8% Fibo. level support near the 1.3820-15 region.
On the flip side, the 1.3950 level now seems to act as immediate resistance. Any further recovery might be seen as a selling opportunity near the 1.3975-80 region (38.2% Fibo. level). This, in turn, should cap the GBP/USD pair near the key 1.4000 psychological mark, marking a three-week-old ascending trend-line support breakpoint.
GBP/USD 4-hourly chart
Technical levels to watch
