- GBP/USD bulls print a fresh cycle high, but resistance is strong.
- DXY is building the case for an upside continuation and a correction into deeper resistance.
In a follow up to the prior analysis, GBP/USD Price Analysis: Bulls taking charge above critical long-term support structure, cable has indeed moved higher as expected.
Prior analysis
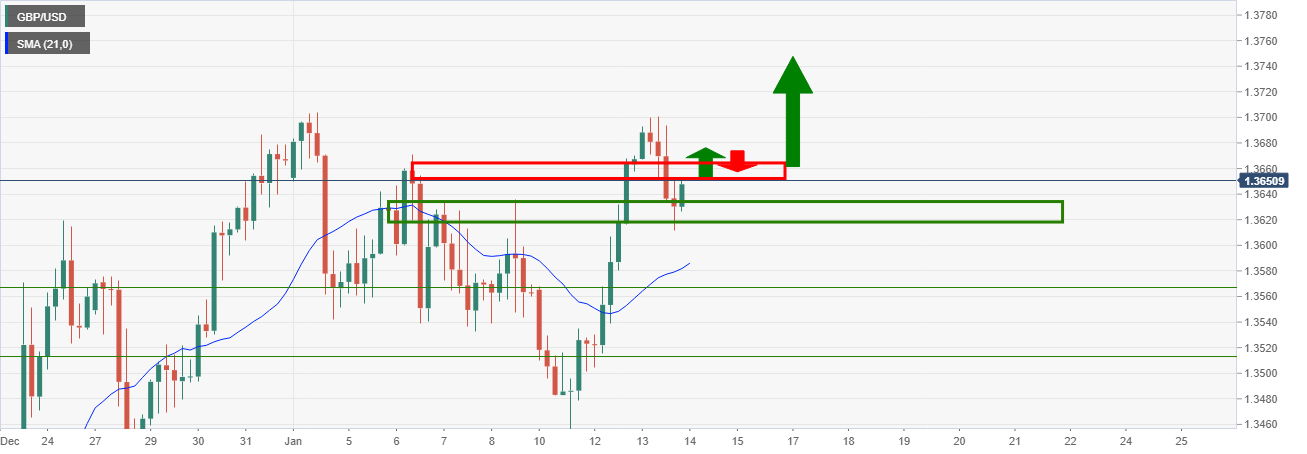
In the above 4-hour chart, the price was testing support and it was highly probable, that following a retracement such as this, that the price would extend the bullish trend.
Current state of play for GBP/USD
The bulls have subsequently taken on the resistance and have gone on to print a fresh cycle high, the highest level since May 2018:
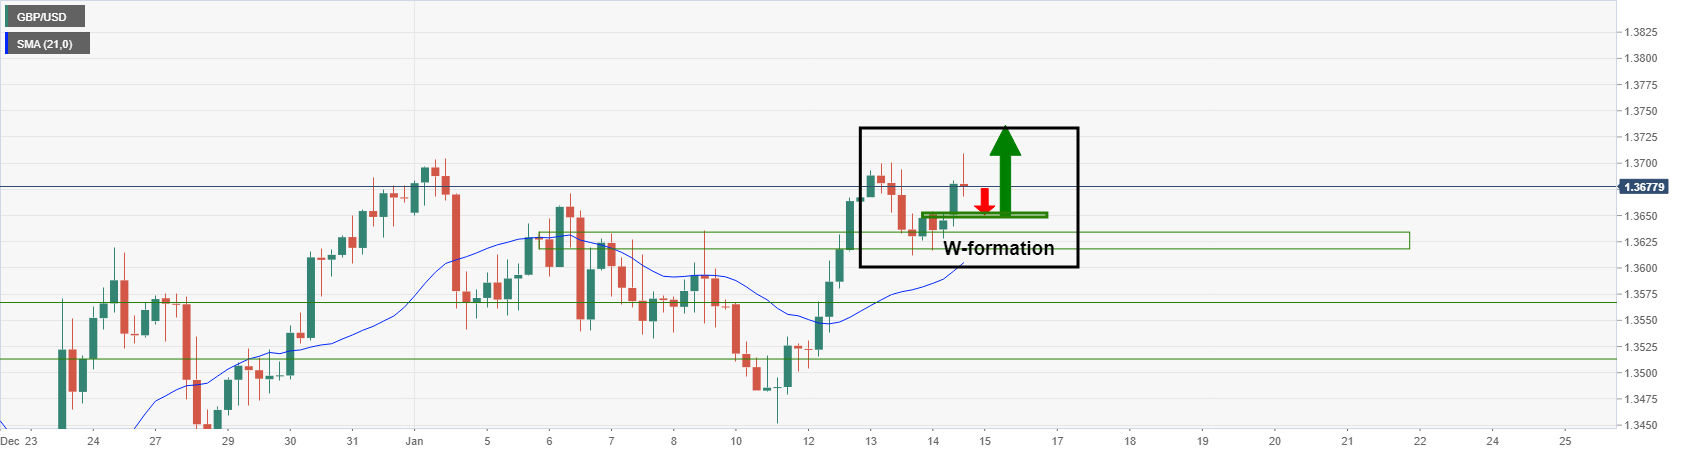
The 4-hour chart has now formed a W-formation and following a 38.2% Fib correction to the nose of the W, a bullish continuation would be probable.
DXY bulls in play
That being said, the US dollar is in favour of the markets and a prolonged recovery would cap the pound’s advance.
Overhead resistance lies with the monthly chart:
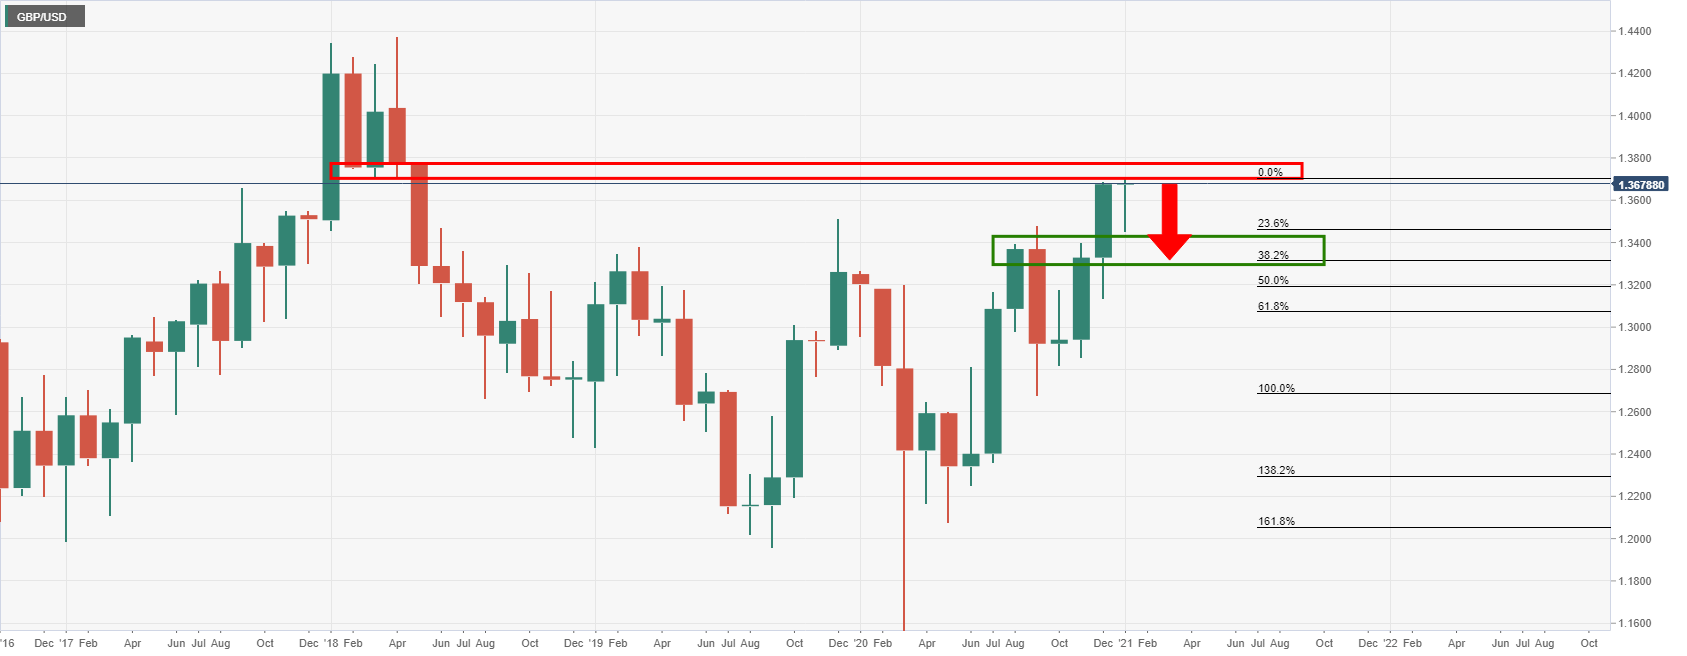
As can be seen, the price is running up to a probable strong level of resistance.
Given the how far the pound has travelled over the past few months without a meaningful correction, there is a high probability that the price will revert back to test support and the confluence of a 38.2% Fibonacci retracement.
This would be especially true if the DXY does indeed continue to correct:
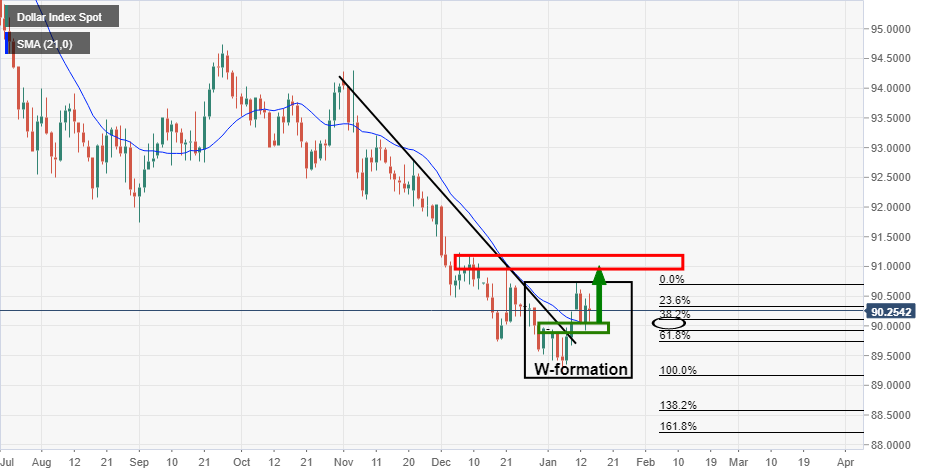
The daily chart shows the index has penetrated beyond dynamic trendline resistance, retested the support of the W-formation’s neckline and is subsequently building a case for an upside continuation towards resistance.
