- GBP/USD marks another pullback below 1.3300, nears the upper line of a bearish formation.
- Overbought RSI conditions add to the hopes of a U-turn.
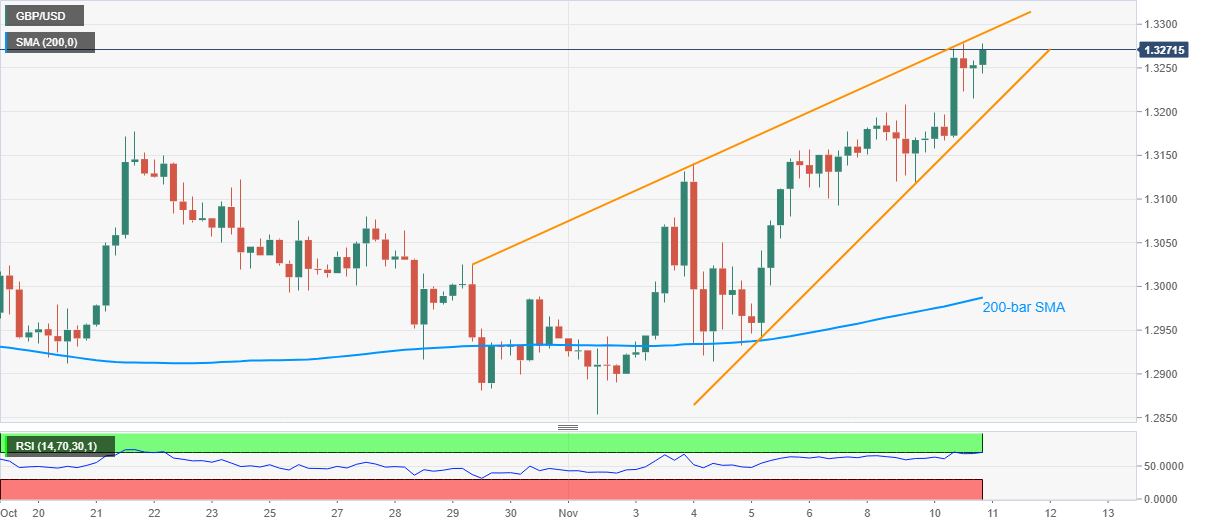
- Late-October top, 200-bar SMA offer extra filters to the downside.
GBP/USD eases to 1.3267 amid the initial Asian trading on Wednesday. In doing so, the Cable marks another failure to cross 1.3280 while keeping a two-week-old rising wedge bearish pattern intact. Other than the inability to cross the immediate resistance, overbought RSI also favors the short-term sellers.
It should, however, be noted that the October 21 high near 1.3175 becomes additional support, other than the support line of the rising wedge around 1.3195, before recalling the bears.
In doing so, the GBP/USD prices can target a 200-bar SMA level of 1.2987 while keeping the monthly low of 1.2854 for the bears to cheer afterward.
Alternatively, an upside clearance of 1.3280 needs a successful break above the stated resistance line, at 1.3290, as well as the 1.3300 threshold to suggest the pair’s further upside.
Should the GBP/USD buyers keep reins above 1.3300, the 1.3350 level may pose as a buffer before highlighting September’s high of 1.3482.
GBP/USD four-hour chart
Trend: Pullback expected
