- GBP/USD bulls in charge and target a retest of the monthly highs.
- The hourly conditions are already heavily bullish with price testing resistance.
GBP/USD is attempting to penetrate deeper into resistance territory on the longer-term time frames and the following is a top-down analysis that arrives at a bullish thesis.
Monthly chart
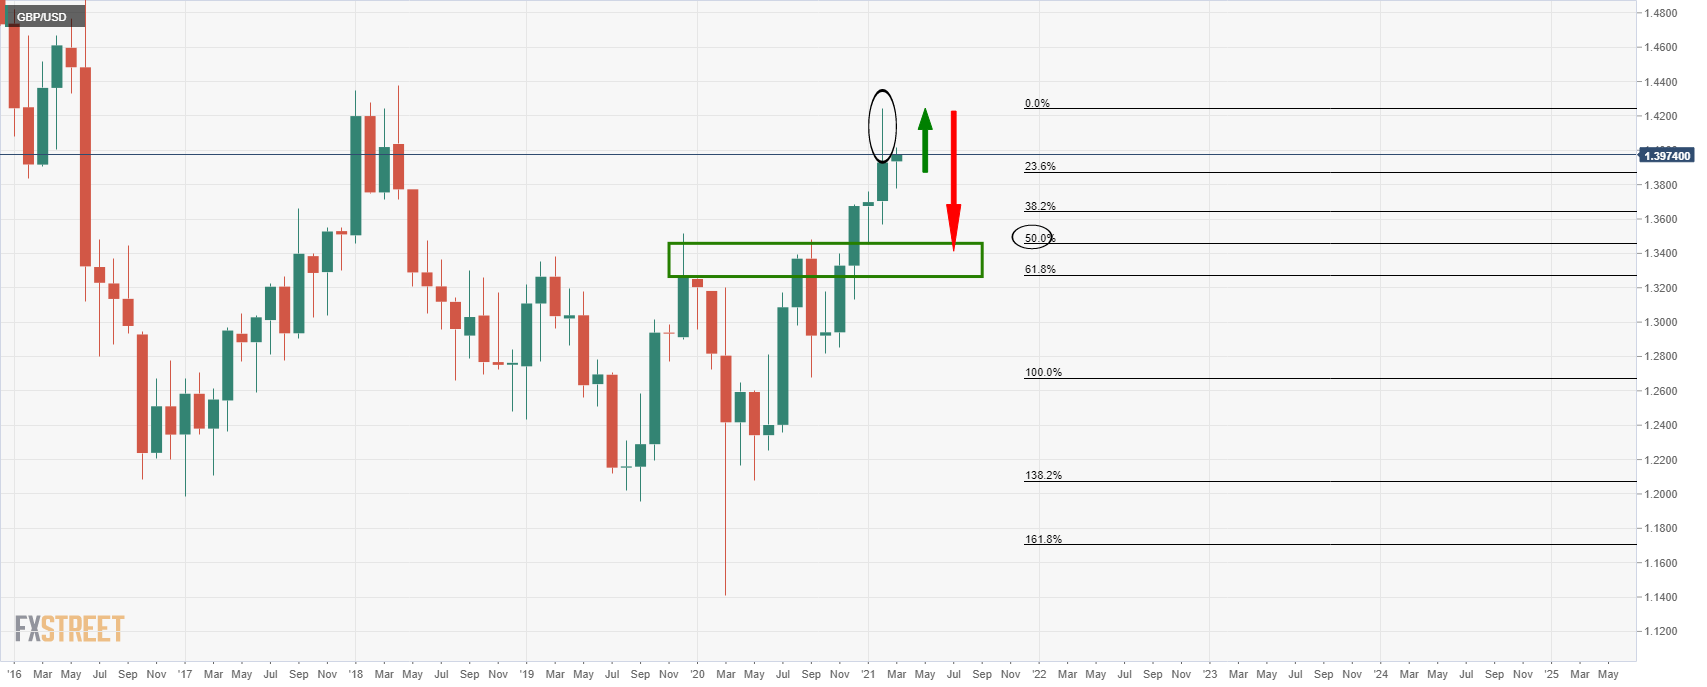
The March bearish wick represents the weekly and daily rejections that have since established a support structure worth noting.
The overall outlook is bearish, however, as the price would be expected to correct the monthly impulse.
Weekly chart
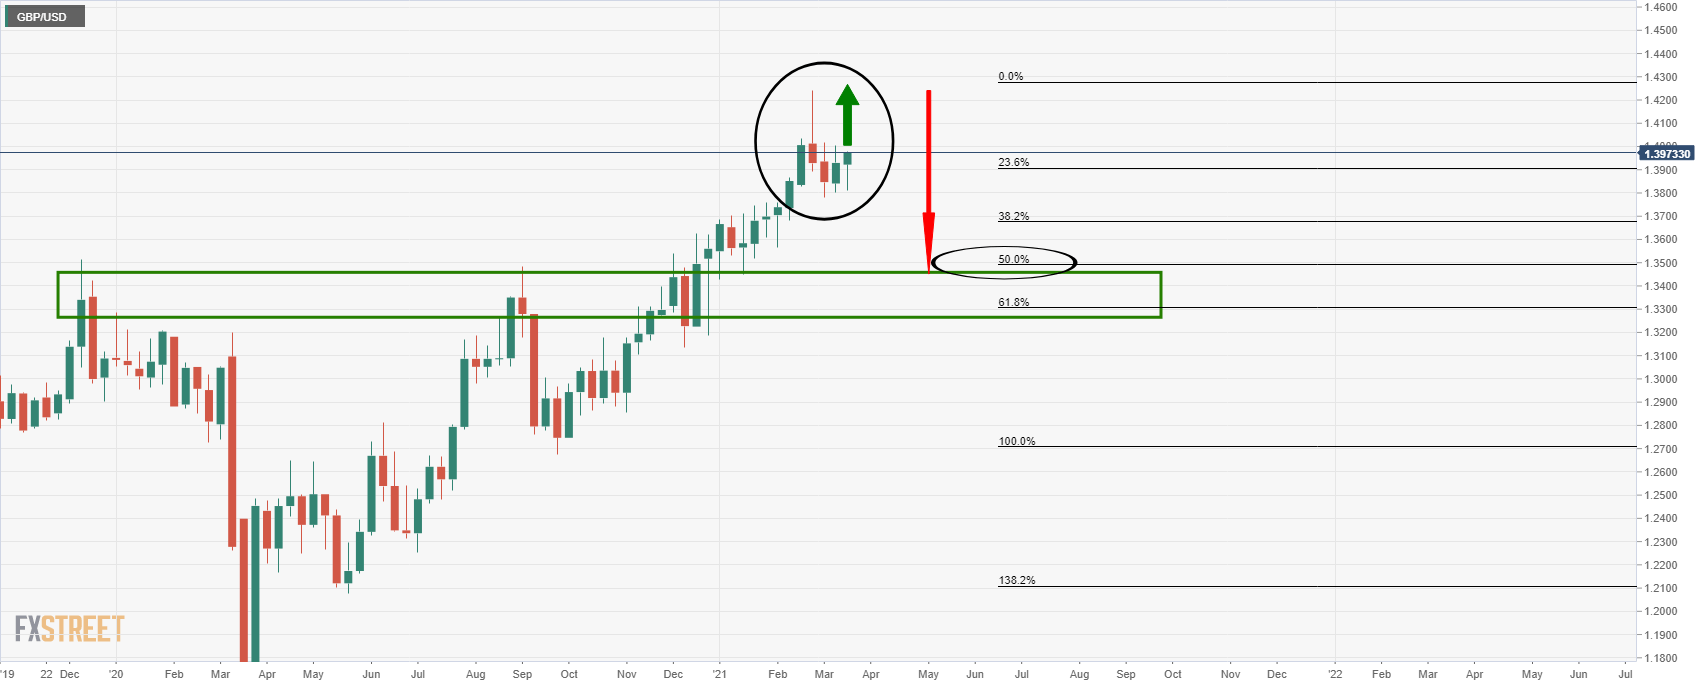
As can be seen, the price is attempting to move up from support and would be expected to fill in both the monthly and weekly wick.
Daily chart
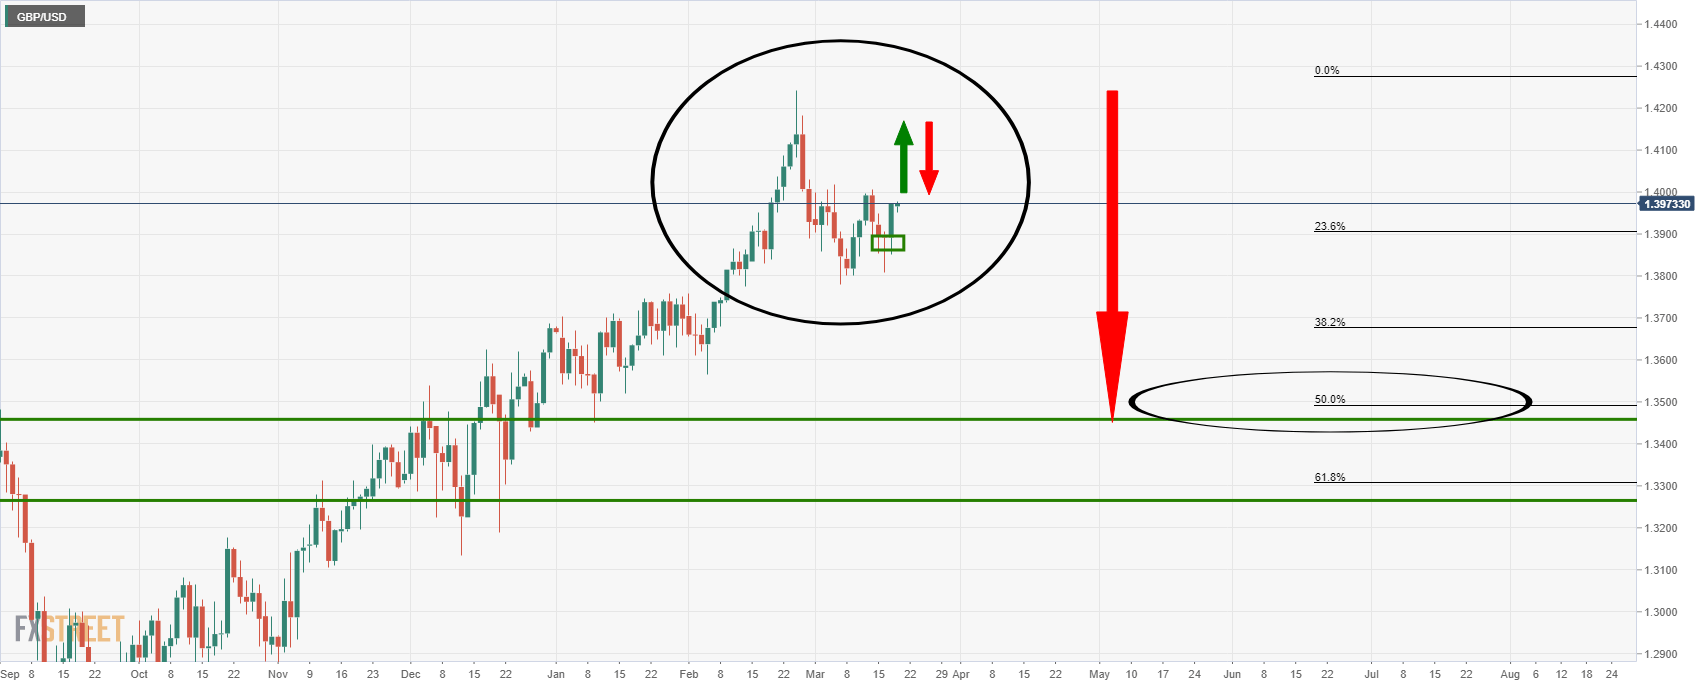
The daily chart could now be expected to see the price test the recent daily highs and move deeper into the supply zone.
1-hour chart
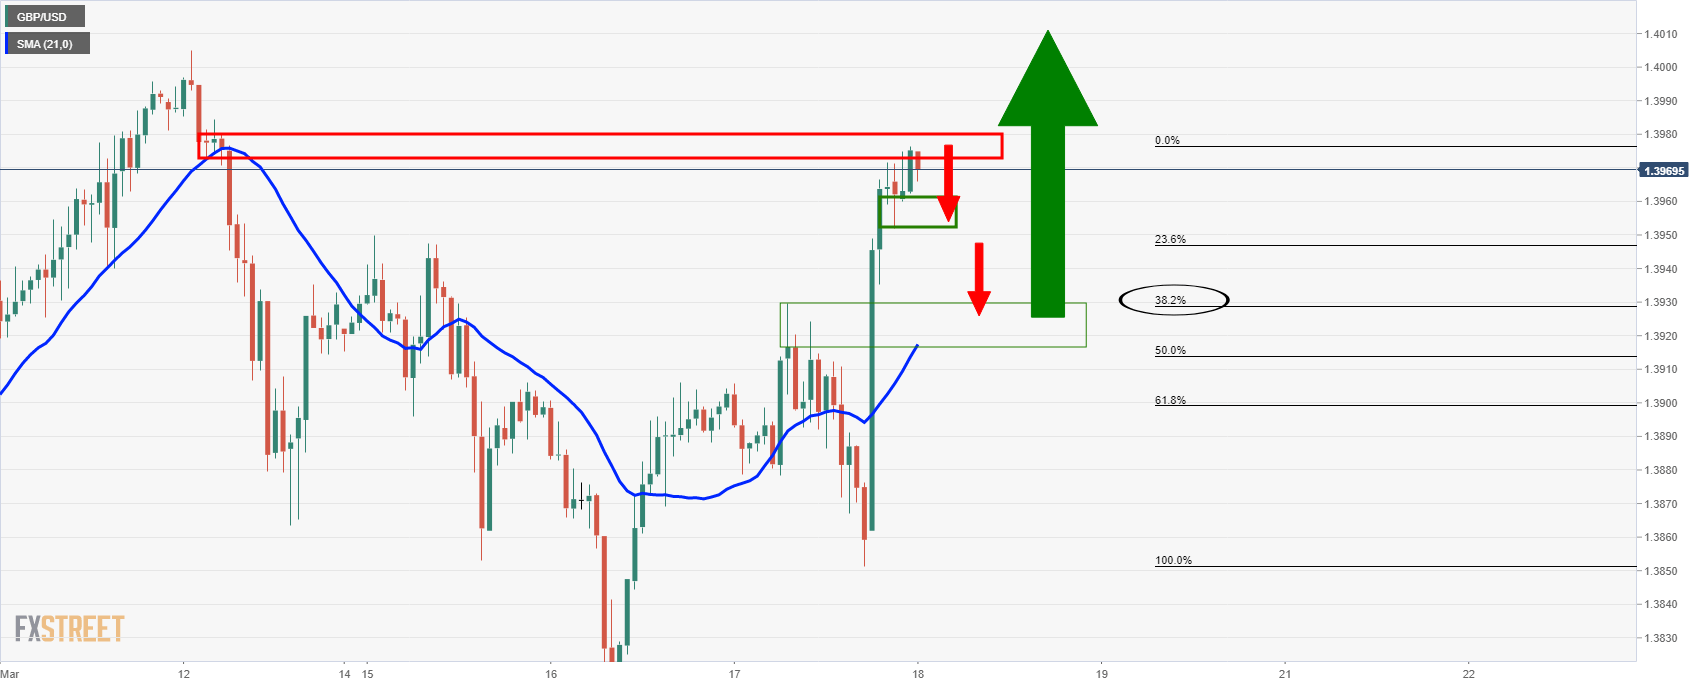
However, the environment is already bullish and the price is attempting to move higher from hourly support.
That being said, failures at the already hourly resistance could pressure the bulls back towards a significant retracement area that coincides with old hourly resistance.
In doing so, the bulls will have a discount to reengage to target a higher high on the daily chart.
