- GBP/USD flirts with the key 50-HMA support at 1.3758.
- The hourly chart paints a bearish picture for the cable.
- 100 and 200-HMAs bear cross backs the case for more downside.
Following an impressive recovery seen on Wednesday, sellers have returned in early European trading this Thursday, downing the GBP/USD pair to critical support.
The powerful support lies at the 50-hourly moving average (HMA) at 1.3758, which the GBP bulls managed to regain in the last hour after a brief break below the latter.
If the spot closes the hourly candlestick below the abovementioned key support then a steep drop towards the rising trendline support at 1.3731 cannot be ruled out.
Further south, the bears could challenge the March 30 low of 1.3706 if the downside gains momentum.
The relative strength index (RSI) points south towards the oversold region while below the 50 level, allowing room for more declines.
A bearish crossover spotted on the said time frame also adds credence to the bearish bias. The 200-HMA pierced through the 100-HMA from above charting a bear cross.
GBP/USD: One-hour chart
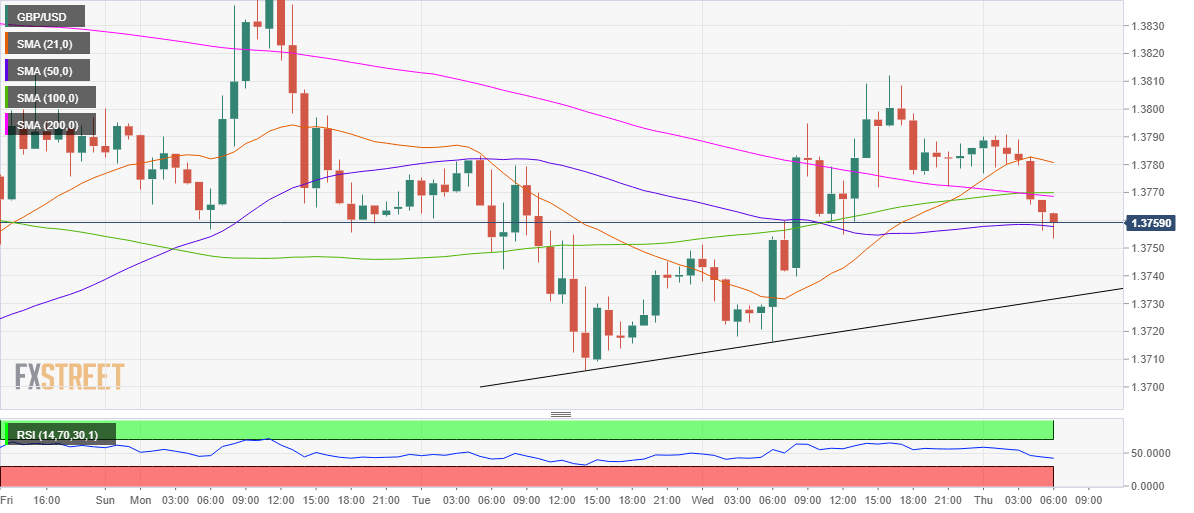
On the flip side, should the bulls manage to resist above the 50-HMA support then a test of stiff resistance around 1.3770 could be on the cards. That level is the confluence zone of the 100 and 200-HMAs.
The next upside target for the buyers aligns at 1.3781, the downward-pointing 21-HMA.
All in all, the path of least resistance appears to the downside in the near-term.
GBP/USD: Additional levels
