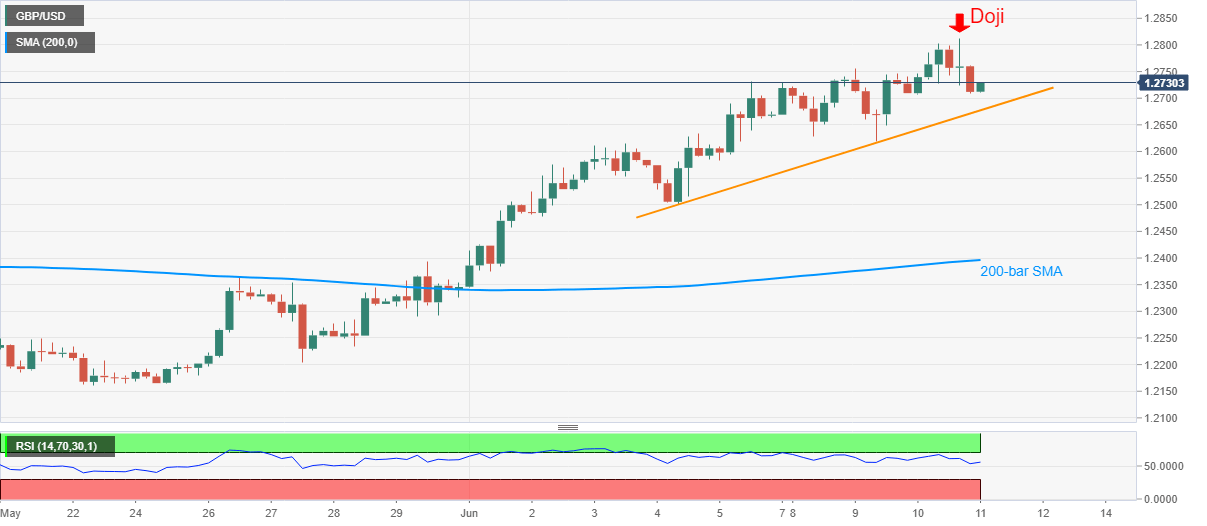
- GBP/USD retreats from fresh three-month high of 1.2813, flashed the previous day.
- A gradual weakness in RSI from overbought territory, trend reversal suggesting candlestick favor the bears.
- Bulls may await a sustained break above 1.2800 for fresh entries.
GBP/USD prints mild losses of around 0.20% while declining to 1.2727, intraday low of 1.2708, amid the Asian session on Thursday. The Cable pair surged to the fresh high since March 12 after the US Federal Reserve’s monetary policy meeting. Though, the quote failed to stay positive near multi-day top amid overbought RSI conditions.
Considering the quotes weakness past-Doji candlestick formation at the three-month top, coupled with the RSI line’s move, the sellers are likely waiting for an entry. In doing so, a downside break of the one-week-old support line, currently near 1.2675 now, becomes necessary.
Should there be a clear decline past-1.2675, a 200-bar SMA level near 1.2400 could lure the bears. However, June 04 bottom surrounding 1.2500 could offer intermediate stop during the fall.
Alternatively, 1.2800 becomes the immediate upside barrier for the pair to cross, a break of which can escalate the north-run towards February month low near 1.2850.
During the pair’s additional rise above 1.2850, a downward sloping trend line from December 13, 2019, at 1.2860 now, will become important to watch.
GBP/USD four-hour chart
Trend: Pullback expected
